
Guide to Recognizing and Using Chart Patterns in Trading
📊 Master key chart patterns to spot market trends, optimize entries & exits, and boost your trading strategy with practical tips and risk management.
Edited By
Oliver Morgan
Understanding chart patterns is fundamental for traders aiming to predict market movements accurately. These patterns provide visual clues about potential price actions, helping you make more informed decisions, whether you trade stocks, forex, or cryptocurrencies.
Chart patterns fall into two main categories: reversal and continuation. Reversal patterns hint that the current trend might end soon, while continuation patterns suggest the trend will persist. Recognising these can significantly improve timing your entries and exits.

Some common patterns Pakistani traders encounter include:
Head and Shoulders: Often marks a trend reversal, signalling a likely price drop after an uptrend.
Double Top and Double Bottom: Indicate resistance or support levels where the price may reverse.
Triangles (Ascending, Descending, Symmetrical): Show periods of consolidation, hinting at an upcoming breakout.
Each pattern carries distinct implications, and their reliability depends on volume confirmation and context within broader market trends. For instance, seeing a head and shoulders pattern on the PSX index with increased trade volume gives weight to the reversal signal.
Remember, no pattern guarantees outcomes. Use them alongside other indicators and market news to reduce risks.
Practical tip: Regularly annotating your charts with these patterns improves recognition speed over time. Traders in Karachi and Lahore often use local broker platforms that integrate charting tools, offering the chance to practise spotting these patterns live.
To deepen your understanding, several free PDF guides by reputable financial educators cover pattern drawing and interpretation. You can access these resources through trading forums, educational websites, and platforms specialising in Pakistani markets.
Mastering chart patterns requires patience and practice. But once you grasp how to read them, you open the door to smarter trading decisions that suit Pakistan’s fast-moving markets.
This article will walk you through key patterns, how to spot them effectively, and where to find reliable free PDFs to keep your skills sharp.
Understanding trading chart patterns is fundamental for anyone aiming to make informed decisions in financial markets. These patterns provide a visual representation of price movements over time, allowing traders to anticipate potential future trends. Mastering chart patterns helps traders identify entry and exit points more confidently, reducing guesswork in volatile markets like the Pakistan Stock Exchange (PSX) or forex pairs such as PKR/USD.
Definition and purpose: Chart patterns are specific formations on price charts that emerge from the collective behaviour of market participants. They serve as signals that hint at potential price directions—whether the price will reverse, continue, or consolidate. For example, a “Head and Shoulders” pattern typically suggests an upcoming reversal from a bullish to a bearish market.
Traders rely on these patterns to simplify complex market data. Instead of analysing every tick, they focus on shapes that condense price action into readable signals. This method streamlines decision-making and can improve timing for trades.
How patterns reflect market psychology: Each chart pattern reflects the tug-of-war between buyers and sellers. For instance, a rising triangle signals buyers gradually gaining strength, pushing prices higher while sellers hesitate at resistance levels. This tug-of-war mirrors traders’ emotions—fear, greed, hesitation—that drive market behaviour.
Understanding market psychology behind chart patterns lets traders read beyond numbers and spot momentum shifts early. A sudden spike in volume at a breakout confirms that buyers or sellers have stepped up, validating the pattern’s signal.
Predicting price movements: Chart patterns give clues on where the market is headed next. Traders often use them to forecast price targets based on pattern dimensions—like the height of a triangle or the drop from a head to shoulder in a reversal formation. For example, recognising a double bottom on a PSX stock chart can highlight a strong support level, suggesting price will likely rise from that base.
Such predictions help traders position themselves advantageously before larger market moves, avoiding late entries that reduce profit potential.
Risk management benefits: Besides signalling opportunities, chart patterns help manage risk. Patterns clearly identify levels where trades become invalid—called stop-loss points. A well-placed stop loss below a breakout confirms where a trend reversal would be a strong possibility.
This approach limits losses and preserves capital, which is essential in Pakistani markets where sudden news or external shocks can trigger unexpected moves. Charts also help estimate potential reward-to-risk ratio, guiding traders whether the trade is worth entering.
Chart patterns are more than just shapes on charts—they provide a framework to understand market mood, predict price moves, and control risk efficiently.
By mastering these patterns and their psychological roots, you stand better prepared to navigate Pakistan’s dynamic markets with greater confidence and precision.
Chart patterns help traders make sense of price movements by indicating potential market direction. Understanding these patterns improves predictions and risk control, especially when trading stocks, forex, or commodities here in Pakistan. The common patterns outlined below offer practical insights that many experienced traders watch for in markets such as the Pakistan Stock Exchange (PSX).
The Head and Shoulders pattern signals a market trend reversal from bullish to bearish. It consists of three peaks: two smaller shoulders surrounding a larger head. When the price breaks below the neckline that connects the lows between peaks, it typically signals a sell-off. For instance, KSE-100 stocks often show this pattern before a short-term correction. Traders use it to exit long positions or open short trades.

Double Tops and Double Bottoms reveal strong resistance or support levels. A Double Top occurs when the price reaches a peak twice but fails to break higher, hinting at a declining trend. Conversely, a Double Bottom forms when the price drops to a low point twice and starts rising, indicating upward momentum. Spotting these patterns in shares like OGDC or HBL can guide entries or exits, reducing sudden losses.
Triangles are consolidation patterns that suggest pauses before the prevailing trend continues. An ascending triangle has a flat upper resistance line with rising lows, often leading to upside breakouts. Descending triangles feature a flat support base with falling highs, usually breaking downward. Symmetrical triangles show converging trendlines indicating potential breakouts either way. Traders watch forex pairs like PKR/USD for these setups.
Flags and pennants indicate brief pauses in a strong trend. Flags appear as rectangular consolidations slanting against the prior trend, while pennants look like small symmetrical triangles. Both typically follow rapid price moves and signal continuation once the price breaks out. Commodity traders, for example in oil or gold markets, frequently rely on these patterns to time entries during volatile swings.
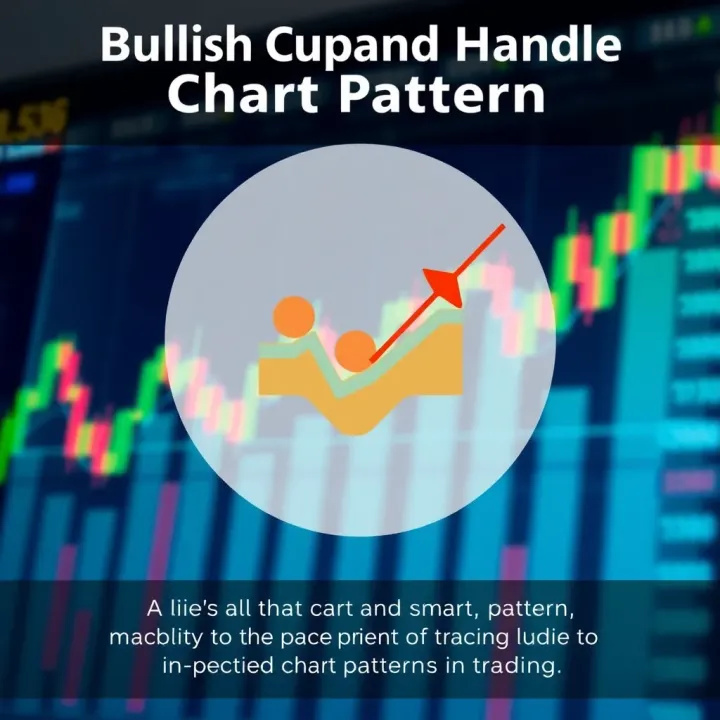
The Cup and Handle pattern mimics a tea cup’s curved shape followed by a smaller consolidation "handle." It suggests a bullish continuation after a period of consolidation. For PSX investors, this pattern in blue-chip stocks like MCB can indicate sustainable upward moves, providing clear entry points.
Wedges are slanting price patterns where trendlines converge, foreshadowing reversals or continuations. A rising wedge within an uptrend often signals bearish reversal, while falling wedges hint at bullish reversal. These require close attention to volume changes to confirm validity. Traders benefit from spotting wedges in volatile sessions to avoid acting against impending trend shifts.
Recognising these chart patterns and interpreting them in local trading contexts is a practical skill that can improve your timing and confidence in the markets.
Knowing such patterns helps you act more decisively, whether trading PSX shares, PKR/USD forex, or commodities. Keep refining this knowledge with real charts and up-to-date resources to sharpen your trading edge.
Knowing how to read chart patterns properly can make a big difference in trading results. Recognising these patterns is just the start; interpreting them with precision helps you gauge market sentiment and predict future price moves more reliably. This part focuses on combining volume signals and timing strategies for entry and exit, which many traders often overlook but are critical for minimising risks and maximising gains.
Volume measures the number of shares or contracts traded during a specific period and acts as a key signal confirming chart patterns. For instance, a breakout from a resistance line on a pattern like a triangle carries more weight if it occurs alongside high trading volume. Without volume backing, breakouts often turn out to be false signals, leading to wasted trades.
In Pakistan’s volatile markets, volume helps filter noise, especially in stocks with erratic price action. For example, a head and shoulders pattern forming with increasing volume during the right shoulder can strengthen the case for an upcoming trend reversal, giving traders greater confidence to act.
When studying chart patterns, watch for volume spikes at critical price levels. A rising volume trend while price ascends can indicate the strength of a continuation pattern like a flag or pennant. Similarly, in a double bottom, a surge in volume at the second low often shows increased buying interest, signalling a reversal.
Practical tip: Compare volume against its average over the last 20-30 sessions to spot unusual activity. Many charting platforms used by Pakistani traders offer easy overlays of volume averages, which help judge whether volume supports the price move or not. This is especially helpful during earnings announcements or geopolitical events affecting PSX stocks.
Successful trading relies heavily on entering and exiting positions at the right time. Chart patterns provide clues, but recognising breakout and breakdown points ensures you line up with market momentum rather than fighting it.
A breakout occurs when price breaches a resistance level with conviction, signalling potential for upward momentum. Conversely, a breakdown is the fall below a support line. Spotting these points early lets you join the move near the start, increasing profit potential.
For example, consider the ascending triangle pattern prevalent in commodities like gold. Waiting for price to convincingly cross above the horizontal resistance—backed by volume—can set you up for a favourable entry. Pakistani forex traders tracking PKR/USD pairs also benefit from such breakout reads to time trades better in a market often affected by monetary policy changes.
Risk control is crucial. Place stop-loss orders slightly below key support levels or pattern boundaries to protect against unexpected reversals. For instance, in a double top pattern, a stop-loss just above the two peaks helps cap losses if the reversal fails.
Take-profit targets usually follow measured moves derived from the pattern’s height. For example:
In a head and shoulders pattern, measure the distance from the head to the neckline, then project that downward from the breakout.
For flags and pennants, use the flagpole height as the expected profit range.
This methodical approach helps balance risk and reward clearly, an essential discipline for Pakistani traders navigating markets prone to sudden swings.
Clear interpretation of chart patterns, paired with volume analysis and precise trade timing, provides a structured way to trade smarter rather than harder.
In summary, combining these techniques sharpens your market edge. Master volume signals, identify breakouts and breakdowns carefully, and manage your risk with well-placed stop-loss and take-profit points. This approach fits well with the fast-moving and sometimes unpredictable nature of Pakistan’s trading environment.
Access to free PDF resources on trading chart patterns is valuable for traders and investors who want to deepen their understanding without incurring extra costs. These materials offer detailed explanations, visual examples, and sometimes even case studies that demonstrate how patterns work in real markets. However, the challenge lies in finding reliable and authentic PDFs that provide accurate, up-to-date knowledge rather than outdated or misleading content.
Educational sites with trading resources typically host a treasure trove of PDFs covering a wide range of topics, including chart patterns. Platforms like Investopedia, Babypips, and dedicated trading education sites often provide free eBooks and guides created by market analysts. These materials are especially practical because they explain concepts clearly, use local market examples occasionally, and are regularly refreshed based on market changes.
For example, Babypips offers detailed PDF guides focused on technical analysis that suit beginners and intermediate traders. While they cover global markets, the principles often apply well to Pakistani stocks and forex trading. Such educational PDFs help traders grasp concepts before applying them practically.
Broker and financial institution libraries are another source of trustworthy PDFs. Many reputable brokers in Pakistan and internationally publish free educational content aimed at their clients. For instance, popular brokers offering PSX access may provide downloadable PDF guides tailored to local market conditions. Likewise, some banks and financial institutions share learning materials on technical trading and risk management through their online portals.
Using broker-provided PDFs adds the benefit of practical insights drawn from market experience and sometimes contain proprietary data analysis tools or indicators that many traders find useful. Additionally, these documents often come with disclaimers clarifying their educational purpose, contributing to realistic expectations.
Assessing authorship and publisher credibility is crucial before trusting any free PDF. Look for documents authored by recognised market analysts, experienced traders, or institutions with solid reputations. For example, a PDF published by a licensed broker registered with the Securities and Exchange Commission of Pakistan (SECP) carries more weight than an unknown source.
Check if the author has relevant qualifications or a professional trading background. Sometimes, authors linked with well-known trading academies or financial news outlets tend to produce more accurate content. Authentic PDFs usually also reference their data sources and use clear, jargon-free language that aids comprehension.
Checking for updates and edition relevance ensures you’re learning current practices. Trading strategies evolve with market trends and technology changes; old PDFs may show methods that no longer work effectively. For example, a guide from five years ago might miss recent developments like algorithm-driven trading or the impact of Pakistan’s regulatory adjustments.
Always prefer recent editions or PDFs that indicate a revision date. Educational sites and brokers typically update their resources annually or when significant market events occur. This keeps the material aligned with the reality of dynamic markets like the Karachi Stock Exchange (KSE) or forex pairs such as PKR/USD.
Remember, relying on verified and updated free PDF guides boosts your trading confidence and sharpens your decision-making in market analysis without unnecessary expense.
By focusing on trusted platforms, checking authorship, and ensuring content freshness, traders in Pakistan can find valuable free resources that enhance their understanding of chart patterns and overall trading skills.
Chart patterns offer valuable insights for traders on the Pakistan Stock Exchange (PSX) and in other local markets. They help anticipate price movements by interpreting trader behaviour and market sentiment. Understanding these patterns within the context of the Pakistani market allows traders to make informed decisions amid unique local factors such as political developments, economic announcements, and occasional market volatility.
The KSE-100 index, representing large-cap stocks on PSX, often displays classic chart patterns like head and shoulders, double tops, and triangles. For example, a clear head and shoulders pattern in a blue-chip company like HBL can signal a trend reversal to traders, prompting them to adjust positions accordingly. Similarly, flags and pennants appear frequently during price consolidations in sectors such as banking and energy.
Recognising these patterns helps traders spot breakout or breakdown points critical for timing trades in PSX stocks. Such patterns combined with volume analysis can provide more reliable entry or exit points, especially during periods of market uncertainty or after state policy changes that usually impact investor sentiment.
Adjusting strategies for local market behaviour is crucial because PSX differs from international markets in volatility and liquidity. Pakistani markets can react strongly to news like SBP rate changes or geopolitical events, causing sharp but often short-lived price swings. Traders should avoid relying solely on patterns without considering these external factors. Using tighter stop-loss orders and shorter holding periods can mitigate risks in such conditions.
Moreover, many PSX stocks have lower trading volumes compared to global equities, leading to occasional false breakouts. This requires confirmation through additional indicators like Relative Strength Index (RSI) or simple moving averages alongside chart patterns to ensure stronger trade signals.
Forex pairs such as PKR/USD exhibit patterns that help forecast currency movements shaped by Pakistan’s economic policies and external pressures like remittances or trade balances. Chart patterns like wedges and double bottoms often indicate potential reversals in the rupee’s value. For example, a descending triangle in PKR/USD during a period of political turmoil might suggest further depreciation, guiding forex traders in their risk management.
Similarly, many Pakistani traders follow commodity markets, notably oil and gold, which influence domestic inflation and import bills. Chart patterns such as flags or cups and handles appear regularly in oil price charts affected by OPEC decisions or regional instability. Gold prices, on the other hand, often show head and shoulders or double top patterns during global uncertainty phases, helping traders decide on timely entry or exit in commodity trading.
Understanding these patterns assists traders in Pakistan in syncing their strategies with global price movements while factoring in local triggers like import policies or foreign exchange reserves. This combined approach improves forecasting and trade execution in forex and commodities beyond equity markets.
Applying chart pattern knowledge specifically with awareness of Pakistan’s market nuances gives traders an edge in navigating price fluctuations, managing risks, and boosting overall trade effectiveness on PSX, forex, and commodities alike.
📊 Master key chart patterns to spot market trends, optimize entries & exits, and boost your trading strategy with practical tips and risk management.

📉 Explore key bearish chart patterns in trading, learn to spot market declines, and manage risk effectively for smarter decisions in Pakistan and beyond.

📊 Learn key chart patterns in trading with our detailed guide! Understand pattern types, their trading impact, plus get useful PDF resources for practice. 📈

Learn to spot 7 key chart patterns in trading 📈. Understand their traits, signals, and impacts with a handy PDF guide perfect for every trader in Pakistan.
Based on 14 reviews