

Complete Guide to Chart Patterns with PDFs
📊 Learn key chart patterns in trading with our detailed guide! Understand pattern types, their trading impact, plus get useful PDF resources for practice. 📈
Edited By
Oliver Morgan
Forex trading depends heavily on understanding chart patterns that reveal price movements and potential market behaviour. These patterns act like signposts, indicating whether a currency pair is likely to move up, down, or stay steady. Learning to spot and interpret these shapes on forex charts can give traders an edge in making informed decisions.
Studying forex chart patterns involves recognising formations such as head and shoulders, double tops and bottoms, flags, and triangles. Each comes with its own implications for future price trends. For example, a head and shoulders pattern typically signals a trend reversal from bullish to bearish, while a flag pattern suggests a continuation of the current trend after a brief pause.

Beyond just seeing the shapes, reading these patterns correctly requires understanding volume changes and the context within larger market movements. Volume often confirms the strength of a move: rising volume during a breakout increases the reliability of the pattern.
Forex chart patterns provide visual clues on trader sentiments and possible price directions, making them essential tools for anyone serious about trading in volatile currency markets.
PDF guides and resources can greatly assist traders in mastering these patterns. They offer organised explanations, real chart examples, and practice exercises that help reinforce learning. Keeping handy PDFs means you can reference key patterns quickly during your analysis, whether trading on platforms like MetaTrader or local brokerage apps.
Key points to focus on when learning forex chart patterns:
Identify common pattern types and their market signals
Understand how volume supports pattern validity
Combine patterns with other indicators for better accuracy
Use printed or digital PDF resources for on-the-go study and review
By developing these skills, traders in Pakistan and beyond can sharpen their market analysis and adapt strategies efficiently to changing forex market conditions.
Understanding forex chart patterns forms the foundation of effective trading strategies. These patterns help traders spot potential price movements by analysing past market behaviour, offering clues to future trends. For example, recognising a 'Head and Shoulders' pattern can alert traders to a likely reversal, helping them avoid losses or capitalise on new opportunities.
Forex chart patterns act like a roadmap for traders, especially in a market that can otherwise feel unpredictable. These visual formations on price charts summarise market sentiment and momentum, allowing traders to make informed decisions quickly. In volatile currency markets, this makes all the difference between profitable trades and costly mistakes.
Forex chart patterns are specific formations created by price movements plotted over time on a chart. They represent recurring shapes like triangles, flags, or double tops that signal distinct market behaviours. Practically, these patterns reflect the tug of war between buyers and sellers, giving traders a glimpse of the market’s intentions.
For instance, a 'triangle' pattern often shows consolidation, meaning the market is pausing before making a move. Spotting such a shape allows traders to prepare for a possible breakout.
Chart patterns serve as a vital tool in technical analysis, which relies on historical price data to forecast future market directions. By studying these patterns, traders gain insights into market psychology without needing fundamental data like economic reports.
In practice, technical analysts combine chart patterns with other tools—like volume indicators—to confirm signals. A genuine breakout from a triangle pattern combined with rising volume tends to suggest a strong upcoming price move, making the analysis more reliable.
Traders depend on chart patterns to anticipate whether prices will rise, fall or continue sideways. These patterns, backed by historical repetition, offer probabilities rather than certainties, helping traders manage expectations in a risky environment.
Take the 'Double Bottom' pattern, which often signals a trend reversal from down to up. Recognising this trend gives traders a heads-up to consider buying before the market gains momentum, improving their chances for profit.
Beyond predicting direction, forex chart patterns help traders pick the right moment to enter or exit trades. Rather than guessing, traders use patterns to spot when the market sentiment is about to shift.
For example, traders often wait for a breakout from a 'Flag' pattern to enter positions, which reduces the risk of acting prematurely. Similarly, spotting a 'Head and Shoulders' formation allows traders to set exit points to protect profits before a price drop.
Mastering forex chart patterns boosts your market vision and helps you trade with more confidence and precision. It's not magic, but a practical approach grounded in observing the market’s language through price shapes.

Forex chart patterns are essential tools for traders to anticipate market moves and make informed decisions. Recognising these patterns helps you predict shifts in trend direction or continuation, improving your entry and exit timing. Each pattern has a distinct shape and implication, rooted in market psychology, which makes studying them invaluable for anyone active in forex trading.
Head and Shoulders pattern is a classic reversal pattern signalling a change from an uptrend to a downtrend. It’s identified by three peaks: the middle one, or "head," being the highest, flanked by two smaller "shoulders" on either side. For example, if you spot this on the EUR/USD chart after a strong rise, it often means sellers might soon dominate and prices could fall. Traders use the neckline—connecting the lows between the peaks—as a critical support level. When price breaks below this neckline, it confirms the reversal.
Double Top and Double Bottom patterns indicate possible trend reversals as well. A Double Top forms after an uptrend, where price hits a resistance level twice but fails to break it, signalling sellers gaining strength. Conversely, a Double Bottom appears after a downtrend, showing buyers defending a support level twice. For instance, if USD/JPY struggles twice near the same high before dropping, the Double Top warns you of a potential down move. These patterns are especially helpful in volatile markets like forex for spotting trend exhaustion.
Triple Top and Triple Bottom extend the idea of double patterns with three distinct highs or lows. These suggest a stronger signal of reversal but are less common. Suppose GBP/USD forms a Triple Bottom near a support line, it generally means the downtrend is losing steam, and an upward reversal could follow. Because price tests the same level thrice, market sentiment shifts are clearer, offering traders higher confidence in their decisions.
Flags and Pennants show brief pauses in a strong trend before it continues. Flags look like small rectangles slanting against the trend, while pennants form small triangles. Imagine USD/CAD rallies sharply, then consolidates sideways forming a flag. As soon as price breaks out in the original direction, traders expect the prior trend to resume, making these patterns useful for short-term trend following.
Triangles, whether ascending, descending or symmetrical, are continuation patterns reflecting a tug of war between buyers and sellers. An ascending triangle occurs when resistance stays flat but support rises gradually, suggesting buyers gaining ground. A descending triangle is the opposite, signalling sellers’ strength. Symmetrical triangles show converging support and resistance lines, indicating that price could break out in either direction. Watching volume alongside these patterns can confirm the likely breakout, guiding timely trades.
Rectangles or trading ranges represent sideways movement between support and resistance, often signalling consolidation. Price keeps bouncing within a horizontal channel without clear trend direction. Forex pairs like AUD/USD often form rectangles during low volatility phases. Traders waiting for a breakout above resistance or below support use these ranges for entry or exit points, adding a layer of discipline to their trading approach.
Understanding these patterns not only improves your chart reading skills but also helps you manage risks better and time your trades with more confidence.
Identifying forex chart patterns on live charts is a skill that can greatly improve your trading decisions. Spotting these patterns as they form allows you to anticipate price movements, helping you time your entries and exits more effectively. Confirming a pattern before acting reduces the risk of false signals and ensures better confidence in the trade.
The trend preceding a chart pattern often sets the stage for its interpretation. For example, a Head and Shoulders pattern typically signals a reversal after an established uptrend. If you see such a pattern forming without a clear prior uptrend, its reliability diminishes.
In practice, before marking a Double Top, check that the market was climbing steadily. If it was already in a sideways range without clear trend direction, the pattern may not signal a strong trend change. This makes trend direction a crucial starting point for pattern analysis.
Volume is an excellent confirmation tool when spotting forex chart patterns. Usually, volume tends to increase during breakout moves and decreases during consolidation phases.
For instance, when a Pennant pattern breaks upwards, you want to see a significant rise in volume confirming buyers’ strength. Lack of volume on a breakout could mean the move lacks conviction and might fail.
Modern charting software offers useful features like pattern-drawing tools and automatic recognition, which save time and help prevent errors. Platforms such as TradingView, MetaTrader 4, and MetaTrader 5 are widely used in Pakistan and support various indicators and overlays to enhance pattern spotting.
These software solutions also let you zoom into specific timeframes and compare historical patterns easily. This flexibility allows you to confirm patterns on 15-minute charts or daily charts, depending on your trading style.
Indicators like the Relative Strength Index (RSI), Moving Average Convergence Divergence (MACD), and volume oscillators provide additional confirmation. For example, if a Triangle pattern forms and RSI shows divergence, this supports the likelihood of a breakout.
Combining patterns with indicators reduces guesswork. If the pattern suggests a bullish breakout but the MACD remains bearish, waiting for clearer confirmation can protect you from premature entries.
Practice and patience are key. Use live charts frequently to train your eye for these features and tools. This real-time observation sharpens your ability to spot genuine forex chart patterns reliably.
Forex chart patterns alone don’t guarantee profits. Practical tips help traders use these patterns strategically, improving decision-making and managing risk. By pairing chart patterns with solid risk control and other analysis tools, traders can increase the chance of consistent gains and protect themselves from sudden losses.
Setting stop-loss levels is a fundamental risk management step for pattern-based trades. Once a chart pattern signals a trade, placing a stop-loss just beyond a key pattern boundary or support/resistance level limits potential downside. For example, after spotting a Head and Shoulders reversal, setting a stop-loss slightly above the right shoulder helps protect if the pattern fails. This way, losses stay small if the market moves against you rather than wiping out your account.
Managing position size according to risk tolerance is equally important. A common rule is to risk only 1–2% of your trading capital per trade. If the stop-loss distance is wide in pips or points due to pattern structure, you reduce your position size accordingly to keep risk stable. This prevents overexposure on trades that might otherwise feel appealing. Practical risk management turns chart patterns from speculative plays into disciplined strategies.
Using support and resistance levels alongside chart patterns strengthens signals. These levels act as natural barriers where price tends to pause or reverse. For instance, a bullish triangle forming just above a strong support level gives added confidence the breakout could propel prices higher. If the pattern suggests a breakout but clashes with a major resistance level, it advises caution or waiting for confirmation.
Incorporating momentum indicators helps verify the strength behind chart patterns. Indicators like the Relative Strength Index (RSI) or Moving Average Convergence Divergence (MACD) show if buying or selling pressure is rising. For a flag pattern signalling continuation, a rising momentum indicator supports the idea of trend persistence. Conversely, if momentum wanes during a supposed breakout, traders might hold back or tighten stops. This approach balances price shape with underlying market force for better timing.
Using chart patterns with smart risk controls and complementary tools makes trading more reliable than relying on patterns alone. Practical strategies ensure every trade fits your risk appetite and market conditions.
Together, these tips help traders interpret patterns more effectively, make calculated trade entries, and safeguard their capital in the volatile forex market.
Forex chart patterns can be complex for many traders, especially when starting out. Having access to well-organised PDF guides lets you study these patterns at your own pace, without being tied to an internet connection or live charts. This flexibility is particularly useful if you want to revise specific patterns while travelling or during downtime at work.
PDF resources serve as a quick reference when you spot a potential pattern in the market. Instead of sifting through videos or lengthy articles, you can open your guide and compare the live chart with clear images and explanations. This saves time and reduces costly mistakes caused by uncertainty.
One major advantage of PDF guides is accessing them offline. Traders in Pakistan often face loadshedding or unstable internet, so having pattern references saved on your device means you can keep learning uninterrupted. For example, if you use Daraz or Easypaisa during peak hours and lose connection, your Forex PDFs remain accessible.
Besides offline use, PDFs allow quick searches for specific patterns like “Head and Shoulders” or “Triangles”. This comes in handy during fast market moves, helping you make timely decisions without delay. Instead of toggling between tabs, you open your bookmarked guide and check details in seconds.
Quality PDFs typically cover dozens of Forex chart patterns in one place, from reversal to continuation types. This completeness prevents you from hunting multiple sources for scattered information. A single well-made guide often presents patterns with annotated charts, entry-exit signals, and risk management tips.
For instance, some guides include patterns rarely discussed on popular sites, like the “Diamond Top” or “Broadening Wedge”. Access to these less common forms widens your analytical toolkit. Also, comparison tables summarising pattern strength and reliability help traders prioritise strategies effectively.
Many reputable brokers and educational sites publish free PDF guides as part of their training resources. These are usually accurate and updated regularly to reflect current market conditions. For example, platforms like IG, FXTM, or educational sections on sites like BabyPips offer downloadable Forex pattern PDFs.
Using their materials means you learn from professionally vetted content rather than random internet scraps. Plus, these portals often provide supplementary tools such as webinars or quizzes alongside PDFs, which helps solidify your understanding.
Beyond official sources, Forex trading communities in Pakistan and abroad frequently share PDF ebooks covering chart patterns and strategies. These can range from beginner-friendly compilations to deep-dives by experienced traders.
Though valuable, community materials require careful selection. Verify authorship and reviews before relying on any guide to avoid outdated or misleading information. Common platforms hosting such content include Telegram trading groups, Forex forums, and local trading academies’ websites.
Always cross-check your PDF guides with live charts and your broker’s analysis tools. Relying solely on static materials without practical application can lead to errors in fast-moving Forex markets.
In short, easily accessible and trustworthy PDF guides enhance your ability to spot and trade Forex chart patterns confidently. Downloading comprehensive, verified PDFs ensures you keep learning, even offline, improving your trading edge in Pakistan’s challenging market environment.
📊 Learn key chart patterns in trading with our detailed guide! Understand pattern types, their trading impact, plus get useful PDF resources for practice. 📈

Learn to read candlestick patterns 📈 in technical analysis with our clear guide, plus download reliable PDFs 📄 for traders in Pakistan 🇵🇰.

📊 Learn key chart patterns in technical analysis to improve your trading skills. Explore major types and access reliable Pakistani resources like books and PDFs.
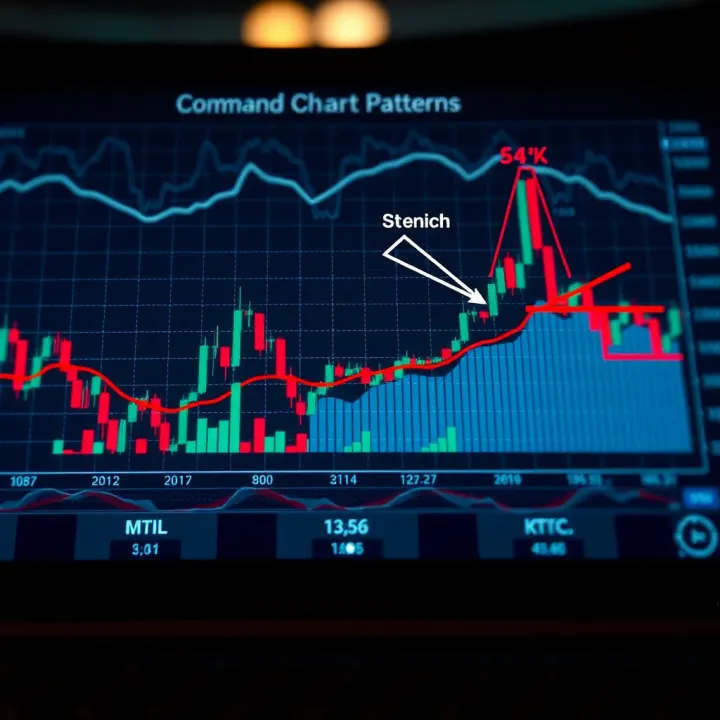
📊 Learn key chart patterns from expert books to spot market trends and price moves. Essential tips tailored for Pakistani traders aiming for smarter investments 🚀
Based on 12 reviews