

Understanding Chart Patterns for Traders in Pakistan
📊 Learn key chart patterns in technical analysis to improve your trading skills. Explore major types and access reliable Pakistani resources like books and PDFs.
Edited By
George Harris
Chart patterns serve as a practical tool for traders and investors alike, helping to predict price movements and identify emerging trends in financial markets. For those active in Pakistan’s stock market or cryptocurrency exchanges, understanding these patterns means reading market sentiment better and making more informed decisions.
This guide outlines essential chart patterns used in technical analysis and explains how you can leverage knowledge from chart patterns books effectively. Unlike random guesswork, chart patterns offer a visual summary of market psychology—showing where buyers and sellers are stepping in or backing off.
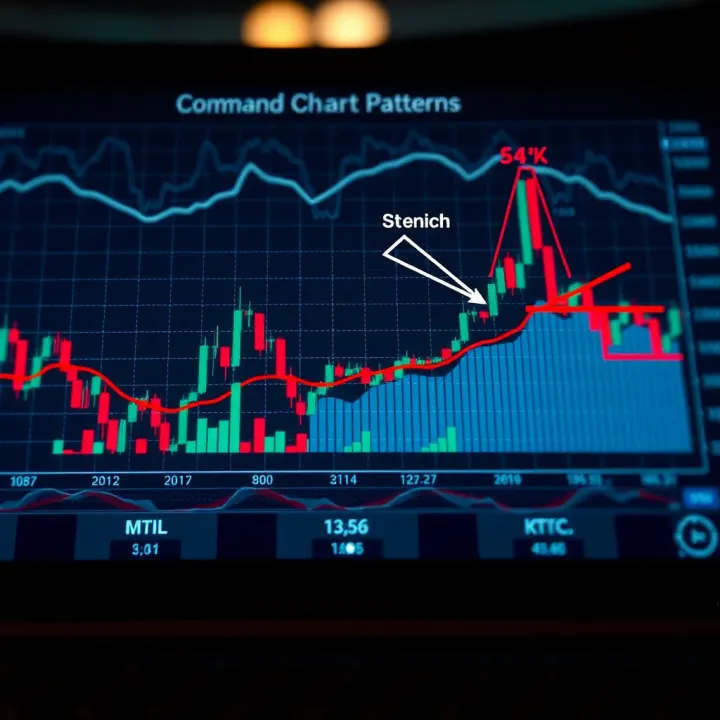
Some common patterns include head and shoulders, double tops and bottoms, triangles, and flags. Each has unique signals: for instance, a head and shoulders pattern often indicates a trend reversal, while triangles can signal continuation or breakout points. Knowing these helps you plan entry or exit points rather than reacting to every market twitch.
Mastering chart patterns requires not only recognising shapes but also understanding volume trends and price action around them. This is where comprehensive chart patterns books come handy—they provide detailed explanations, examples, and exercises tuned for practical application.
Investors in Pakistan should note that typical market conditions here—such as lower liquidity and occasional news-driven volatility—can affect pattern reliability. Hence, complementing pattern analysis with local market insights, economic indicators, and fundamental factors improves accuracy.
To make the most of chart patterns books:
Start with basics and gradually explore advanced patterns.
Practice by applying patterns on real charts from PSX or cryptocurrency platforms.
Note the difference between bearish and bullish patterns to avoid confusion.
Use supportive tools like volume indicators and moving averages to confirm signals.
This section sets the stage to explore individual patterns and tactics in depth, aiming to give Pakistani traders solid knowledge and actionable skills for smarter investments.
Chart patterns serve as a vital tool for traders and investors looking to understand price trends and market behaviour. Recognising these patterns allows you to anticipate possible future movements rather than just reacting to price changes. This skill helps you make more informed decisions in markets like the Pakistan Stock Exchange (PSX) or forex.
Chart patterns are specific formations created by the price movements of an asset when plotted on a chart. They help technical analysts identify potential trend reversals or continuations. For example, a "head and shoulders" pattern often signals a potential market reversal, allowing you to consider selling before the price drops further.
These patterns work as visual cues signalling market sentiment shifts. By studying past price behaviours, traders can estimate where prices might head next, making chart patterns an essential part of technical analysis.
Chart patterns reveal the collective behaviour of buyers and sellers. When a pattern like a "double top" occurs, it reflects hesitation among traders, where the price hits a resistance level twice but fails to break through, indicating weakening buying pressure.
This collective psychology impacts price direction. Understanding these dynamics through patterns lets traders gauge market confidence or fear, enabling them to act accordingly rather than just following the crowd blindly.
Traders use chart patterns primarily to forecast price directions. A clear example is spotting a "triangle" pattern on a daily PSX chart, which can hint at either continuation or reversal depending on the breakout direction. This foresight helps traders position themselves advantageously.
Predicting moves reduces uncertainty, making trading strategies more systematic. Instead of relying on luck, traders use patterns to set entry and exit points based on historical price behaviour.
Chart patterns also assist in risk management. Knowing when a pattern completes, say a "flag" during a strong uptrend, lets traders decide when to enter the trade with lower risk and set stop-loss orders near support levels.
Timing trades using these patterns prevents premature entries or late exits that often cause losses. In the volatile environment of Pakistani markets, this timing can mean the difference between profit and loss.
Understanding chart patterns helps traders not just predict market moves but also manage their trades more efficiently, reducing risks while maximizing potential gains. This makes them invaluable in both local and international markets.
Overall, grasping the basics of chart patterns empowers you to read price charts confidently and improve your trading strategy, whether you deal with shares on PSX, foreign exchange, or cryptocurrencies.
Core chart patterns are the backbone of technical analysis. They paint a clear picture of potential market movements, helping traders make decisions based on how price behaves. Understanding these patterns in detail enables you to spot reversals or continuations in trends more confidently. This section explores the most common chart patterns, categorised into reversal and continuation types, each signalling different outlooks on price direction.

The Head and Shoulders pattern signals a likely reversal from an uptrend to a downtrend. It consists of three peaks: the left shoulder, the head (which is the highest peak), and the right shoulder. When price breaks the neckline joining the two troughs, it confirms the pattern. For example, if PSX stock XYZ forms this pattern over daily charts, it often indicates weakening buying pressure and potential selling ahead. This helps traders exit positions or consider short-selling.
Its inverse, the Inverse Head and Shoulders, suggests a shift from downtrend to uptrend, valuable for timing entry points for buying.
A Double Top occurs when price attempts to push past a resistance level twice but fails, forming two peaks with a moderate decline in between. On breaking below the support between peaks, it confirms the pattern, signalling a bearish reversal. For instance, a Forex pair like USD/PKR showing this on a 4-hour chart might precede a drop.
Double Bottom is the mirror image, with two lows at a support level and a rally afterward, hinting at bullish reversal. It’s quite useful for identifying opportunities to enter long positions once the pattern completes.
Triple Tops and Bottoms are similar to double patterns but with an extra peak or trough, strengthening the signal through repeated failed breaks. Their formation generally signals stronger reversals since the price tests key support or resistance three times. Traders treating a triple top on PSX shares like OGDC might prepare for a significant downtrend if breakdown occurs.
Triangle patterns signal a pause before the existing trend resumes. Ascending triangles show highs capped at a resistance line while lows climb, hinting at upward bias. Descending triangles, on the other hand, feature a flat support line with falling highs, indicating potential bearish continuation.
Symmetrical triangles have converging trendlines showing indecision before the breakout, which can go either way but typically follows the prior trend. For local traders, spotting these on daily or weekly PSX charts aids in planning entries and exits effectively.
Flags and pennants emerge after sharp moves and represent brief consolidation. Flags look like small rectangles tilting against the trend, while pennants form small symmetrical triangles. Both patterns suggest continuation once price breaks in the direction of the prior move.
For example, in cryptocurrency markets like Bitcoin trading on local platforms, these patterns help anticipate rapid moves and time trades with better precision.
Rectangles appear when price moves sideways between parallel support and resistance lines, showing equilibrium between buyers and sellers. This pause often precedes a breakout in the existing trend direction. Recognising rectangles on PSX or Forex charts can help traders avoid false starts and position themselves for meaningful moves.
Recognising these core patterns sharpens your ability to read what the market is telling you. Each has specific traits and implications, but all serve the same purpose: to help predict future price action and manage trades with more confidence.
Reading and confirming chart patterns accurately helps traders avoid false signals and improves the success rate of trades. Without proper confirmation, relying solely on pattern shapes can lead to mistakes, especially in volatile markets like the Pakistan Stock Exchange (PSX) or forex pairs involving PKR. Traders need to combine pattern recognition with volume analysis, timeframe consistency, and technical indicators to build a reliable trading setup.
Patterns on shorter timeframes, such as 15-minute or hourly charts, can provide quick insights for day traders or scalpers. However, these patterns might be less reliable due to market noise. On the other hand, daily or weekly charts reveal stronger, more stable patterns suitable for medium to long-term trades. For example, a bullish triangle forming on a daily chart of a popular PSX stock like Engro Corporation usually holds more weight than a similar pattern on a 5-minute chart.
Always cross-check patterns across multiple timeframes. If an ascending triangle appears on both daily and weekly charts, it confirms stronger buyer interest. Flipping between timeframes also prevents overtrading based on false patterns emerging in brief price swings.
Volume provides critical clues about a pattern’s strength. For instance, during a breakout from a head and shoulders pattern, rising volume confirms market commitment to that direction, signalling a likely trend change. Conversely, if volume stays low during a breakout, the move might not sustain, warning traders to avoid rushing in.
Similarly, for rectangles or channels, volume tends to contract during sideways consolidation and expands on breakout. Volume clues help identify false breakouts, common in the often speculative Pakistani markets, where volume may spike due to news or hype rather than genuine interest.
Relative Strength Index (RSI) measures momentum by comparing recent gains and losses. In chart patterns, RSI can tell if the asset is overbought or oversold. For example, if a double bottom pattern forms but RSI doesn’t show oversold conditions, the pattern’s bounce potential weakens. A rising RSI accompanying a bullish breakout confirms strength.
Moving Averages smooth out price action and highlight trend direction. Using simple moving averages (SMA) or exponential moving averages (EMA), traders can spot support or resistance zones that overlap with pattern outlines. A bullish flag pattern, breaking upwards and crossing above the 50-day SMA with decent volume, offers a practical buy signal. Additionally, moving averages help filter noise by confirming the trend’s bigger picture.
MACD (Moving Average Convergence Divergence) is a momentum indicator showing the relationship between two EMAs. MACD crossing above its signal line often matches a pattern breakout, validating a buy signal. For instance, during an ascending triangle breakout in the forex market involving USD/PKR, a bullish MACD crossover can give extra confidence to enter a long position. MACD divergence — where price moves opposite to the indicator — can warn of weakening momentum even if the chart pattern suggests continuation.
Combining timeframes, volume, and indicators like RSI, moving averages, and MACD gives traders a powerful toolkit to filter out noise and confirm reliable chart patterns suited for Pakistani markets or international trades.
This approach reduces guesswork and improves clarity when analysing the complex signals that chart patterns present. For traders at PSX or forex dealers, mastering how to read and confirm patterns can significantly enhance trading discipline and outcomes.
Books on chart patterns remain a vital resource for traders seeking to improve their technical analysis skills. They provide structured approaches, case studies, and tested rules that go beyond what real-time experience might offer. For traders in Pakistan, studying selected books helps build a strong foundation and adapt strategies to local markets like the Pakistan Stock Exchange (PSX) or forex trading environments.
Books by Thomas Bulkowski offer deep statistical insight and detail that most beginners find invaluable. Bulkowski's work systematically analyses numerous chart patterns using historical price data. His books provide probability-based assessments for different patterns, helping traders understand the chances of success or failure. For example, his analysis highlights how a double bottom pattern often signals a strong reversal, but also cautions about common pitfalls. This practical information can help traders avoid second-guessing their setups and improve trade timing.
Works by John J. Murphy are considered a staple in technical analysis education worldwide. Murphy’s books cover broad concepts from the basics of chart reading to advanced indicator use, making them ideal for both novices and experienced traders. His explanations of patterns are clear, making it easier to spot formations in various timeframes. Moreover, Murphy’s emphasis on combining chart patterns with other tools like moving averages strengthens a trader's toolkit, especially relevant for active traders on PSX or those focused on intraday movements.
Regional adaptations and trading examples tailor concepts specifically for Pakistani markets, addressing local trading behaviours, regulations, and market timing. Such books may include examples from PSX stocks, forex volatility around the PKR, and responses to political events that impact price action directly. This context helps traders apply pattern recognition with a local flavour, rather than relying solely on examples from US or European markets which may behave differently.
Local market case studies are particularly valuable since they provide real trading scenarios from the Pakistani market. These case studies demonstrate how chart patterns played out during major economic events, like the State Bank of Pakistan (SBP) policy announcements or budget reactions. For instance, a local book might detail how the ascending triangle pattern unfolded on a blue-chip stock during a government election period, giving insights rooted in real price movements familiar to Pakistani traders. This practical knowledge reinforces learning and boosts trader confidence.
Investing time in well-regarded books, especially those adapted to Pakistan’s unique financial landscape, equips traders to identify profitable chart patterns and avoid costly mistakes.
Traders aiming for effective technical analysis in Pakistan should consider combining classic global resources with regionally nuanced books for a balanced understanding.
Successful use of chart patterns in Pakistani markets demands tailored strategies reflecting local market dynamics. The Pakistan Stock Exchange (PSX), with its specific trading hours and regulatory environment, responds differently compared to international markets. Similarly, the volatile Pakistani forex market requires practical timing and confirmation strategies for traders looking to spot reliable entry or exit points. This section offers direct advice on how to make chart patterns work well within these contexts.
Selecting an appropriate timeframe is key to effectively reading chart patterns. For PSX, daily and weekly charts often offer clearer signalling due to market volume and lower intraday volatility. Smaller timeframes like 15-minute or 1-hour charts may lead to noise because of limited liquidity on certain stocks. Conversely, for forex trading involving PKR pairs, intraday charts (such as 15-minute and 30-minute) can be more profitable, given the 24-hour nature of global forex markets and the influence of international events.
Traders should match the timeframe to their trading style: swing traders profit from daily/weekly charts, while scalpers rely on short-term charts with fast pattern recognitions. Regardless, confirming a pattern across multiple timeframes often improves trading confidence in Pakistani markets.
Economic data such as the State Bank of Pakistan’s policy rate decisions, inflation reports, and balance of payments figures play an important role. For example, a relief rally following a favourable SBP announcement might confirm a bullish continuation pattern on PSX stocks. Traders ignoring these indicators risk misreading patterns triggered by short-term speculation rather than fundamental strength.
Pakistan’s political stability significantly impacts market sentiment. Election results, budget announcements, or geopolitical tensions can cause sudden moves that distort chart patterns. For instance, a bullish breakout on a textile stock might quickly reverse if unexpected trade restrictions arise. Integrating political news with pattern analysis helps traders avoid misleading signals and position themselves ahead of volatile swings.
A false breakout occurs when a price crosses a pattern boundary but quickly reverses, trapping traders. This often happens in PSX during days with low trading volume or before major holidays when liquidity dips. To avoid falling for false breakouts, wait for confirmation such as a close above/below the breakout level on decent volume or a retest of the breakout point.
Rushing into a trade after a quick breakout without confirmation can lead to losses, especially in a volatile market like Pakistan’s.
Volume analysis helps validate chart patterns, but misreading it can cause mistakes. For example, an apparent breakout on low volume in PSX may not indicate genuine enthusiasm but rather a few large trades or market manipulation attempts. Traders need to compare current volume to average volume over recent sessions and be wary when volume does not support price movement.
In summary, combining chart patterns with timely fundamental analysis and caution around common pitfalls like false breakouts or misleading volume increases can significantly improve trading results in Pakistani markets.
📊 Learn key chart patterns in technical analysis to improve your trading skills. Explore major types and access reliable Pakistani resources like books and PDFs.

🔍 Explore key candlestick patterns to master price moves. Learn single & multiple formations, tips to read signals, and smart combo with indicators!
📈 Learn to identify classic chart patterns in trading with clear guidance and practical tips. Access PDF resources tailored for Pakistani traders to boost your technical analysis skills.

📊 Learn how printable stock chart patterns can boost your trading skills by identifying market trends and making informed decisions with clear visual guides. 📈
Based on 10 reviews