

Complete Guide to Chart Patterns with PDFs
📊 Learn key chart patterns in trading with our detailed guide! Understand pattern types, their trading impact, plus get useful PDF resources for practice. 📈
Edited By
Sophie Hughes
Chart patterns offer traders and investors a visual way to understand market psychology. These shapes form on price charts and reflect the collective buying and selling behaviour of market participants. Learning to identify key patterns can give you an edge in predicting where prices might head next.
In Pakistan's growing stock and crypto markets, becoming skilled at reading chart patterns is especially valuable. It helps in spotting trading opportunities amid local market dynamics like rupee fluctuations, geopolitical events, and sector-specific trends.

Here’s a quick overview to set the stage:
What are chart patterns? Chart patterns are repetitive formations like triangles, head and shoulders, or flags that hint at possible price moves.
Why do they matter? They group price action into familiar shapes that indicate whether bulls or bears are in control.
How to use them? Traders combine pattern recognition with volume and indicators to make informed entry or exit decisions.
Understanding chart patterns is not about guessing but reading the market sentiment that drives price changes. This skill complements fundamental analysis and risk management strategies.
By grasping basic chart patterns and applying them carefully, you can improve timing and confidence in your trades. This article will guide you through the main types of chart patterns and recommend trusted books and PDFs popular among Pakistani traders. These resources help deepen your knowledge with examples from PSX and cryptocurrency data.
This foundation will prepare you to explore patterns more confidently, whether you focus on equities, forex, or digital assets like Bitcoin and Ethereum.
Chart patterns serve as crucial tools in technical analysis, offering traders a visual method to study price movements over time. These patterns represent recurring shapes and formations in price charts, reflecting investor psychology and market dynamics. For anyone trading stocks, forex, or cryptocurrencies in Pakistan, recognising these patterns can improve decision-making by signalling potential market trends.
Chart patterns are specific configurations of price bars or candlesticks on a chart, shaped by market participants’ buying and selling behaviour. For example, a “Head and Shoulders” pattern typically indicates a possible price reversal, while a “Flag” pattern often hints at a continuation of the ongoing trend. Understanding these helps traders anticipate future price moves instead of reacting randomly.
These patterns act like signposts, guiding traders where prices might head next. A trader spotting a 'Double Bottom,' which is a W-shaped pattern, may interpret it as a bullish signal suggesting that the price is likely to rise. Such foresight can enable timely entry or exit from positions, potentially increasing profits or limiting losses.
For Pakistan’s stock market and forex trading, chart patterns are especially relevant due to the markets' inherent volatility and sudden price swings, often influenced by political events, policy changes, or foreign exchange fluctuations. Traders focusing on the Pakistan Stock Exchange (PSX) or currency pairs like PKR/USD will find chart patterns useful in navigating such unpredictability.
One frequent mistake is relying solely on chart patterns without considering other factors. Patterns do not guarantee results—they must be combined with volume, market news, and broader indicators. For instance, a trader might see a breakout but ignore that volume remains low, which could mean the breakout is weak or false.
Volume is a key element that validates chart patterns. When a pattern forms, increased trading volume often confirms the signal. Overlooking volume or technical indicators like moving averages can lead to misreading the market. For example, a 'Triangle' pattern breakout with rising volume tends to be more trustworthy than one with stagnating volume.
False breakouts are another common trap. These occur when prices temporarily break support or resistance levels but fail to sustain the movement, quickly turning back. Traders inexperienced with false breakouts may enter trades prematurely and face losses. In Pakistan’s markets, sudden breakouts might happen due to news events or manipulative trades, so it’s wise to wait for confirmation.
Always confirm chart patterns with volume and other indicators before acting. A pattern without supporting evidence can be misleading and costly.
Recognising these pitfalls allows traders to use chart patterns more effectively, combining them with other tools and maintaining discipline, which is vital for success in Pakistan's dynamic trading environment.
Recognising main chart patterns forms the bedrock of technical analysis for traders and investors. These patterns offer clues about upcoming price movements by revealing market psychology. Spotting them accurately can improve decision-making whether you trade in the Pakistan Stock Exchange (PSX), forex markets, or even cryptocurrency.

Head and Shoulders pattern signals a likely trend reversal. This pattern features three peaks: a higher middle peak (head) flanked by two slightly lower peaks (shoulders). It typically appears after an uptrend, indicating a potential shift towards a downtrend. For example, when a PSX share price forms this pattern, traders may prepare to sell before the price declines. The opposite — inverse head and shoulders — hints at a reversal to the upside.
Double Top and Double Bottom are straightforward reversal signs. A double top occurs when price hits a high twice but fails to break higher, suggesting resistance and a drop ahead. In contrast, a double bottom forms after price hits a low two times, indicating support and a possible rising trend. Such patterns help Pakistani traders time entry and exit, especially in volatile blue-chip stocks.
Rounding Bottom and Saucer patterns develop gradually over weeks or months. The price forms a curved bottom shaped like a bowl, reflecting a slow transition from bearish to bullish sentiment. This pattern is useful in spotting long-term trend changes. In Pakistan’s context, rounding bottoms in companies with steady fundamentals often signal a reliable buy opportunity.
Flags and Pennants appear after strong price moves and represent short breaks before continuation. Flags look like small rectangles slanting against the trend, while pennants resemble small symmetrical triangles. Both suggest the market is pausing but will likely keep moving in the same direction. For intraday or short-term traders in Pakistan’s forex market, recognising these can guide when to hold or add to positions.
Triangles: Ascending, Descending, Symmetrical each tell different stories:
Ascending triangles show rising support and flat resistance, pointing to a potential breakout upwards.
Descending triangles reveal falling resistance with flat support, hinting at downward moves.
Symmetrical triangles suggest price consolidation without clear direction and often precede significant breakouts.
These patterns are common in PSX mid-cap shares and can assist traders in planning trades around expected volatility.
Rectangles or Trading Ranges form when price moves sideways between parallel support and resistance lines. This pattern indicates indecision, with buyers and sellers balanced. Breakouts from rectangles provide clues for directional trades. Pakistani investors can spot these ranges in real estate developers’ stocks, helping avoid premature trades during consolidation phases.
Understanding these main chart patterns and their context lets you read market movements better, reducing guesswork and improving timing for trading or investing decisions.
Chart patterns alone don't guarantee success; their value multiplies when combined with other tools and sound strategies. For traders and investors, especially in Pakistan's volatile stock and forex markets, using chart patterns effectively helps in spotting reliable entry and exit points, managing risks, and improving overall trading discipline.
Volume confirmation plays a crucial role in validating chart patterns. For example, when a breakout occurs from a triangle or a head and shoulders pattern, a surge in volume confirms genuine movement rather than a false signal. In Pakistan’s markets, where liquidity can vary widely, watching volume helps differentiate between meaningful shifts and random price fluctuations.
Moving averages smooth out price data to highlight trends, making them practical for pairing with chart patterns. A common strategy is to check whether a price breakout aligns with crossing a moving average, like the 50-day MA. If a breakout from a bullish pattern occurs above the moving average, it signals stronger momentum. This combination helps Pakistani traders avoid falling into traps caused by noisy market behaviour.
Relative Strength Index (RSI) indicates whether an asset is overbought or oversold. Pairing RSI with chart patterns improves timing for trades. For example, spotting a double bottom pattern while RSI shows oversold conditions in a KSE-listed stock increases the odds of a successful trade. RSI readings around 70 or 30 levels give a clearer picture than patterns alone, especially in Pakistan’s often choppy market environments.
Stop-loss placement is vital for protecting capital against unpredictable market moves. Once a pattern signals an entry, placing a stop-loss just below the breakout level (for bullish setups) limits losses if things go wrong. Pakistani traders must consider volatility, sometimes wider than international markets, when deciding stop-loss distance to avoid premature exits.
Setting price targets based on measured moves helps traders lock in profits realistically. For instance, if a cup-and-handle pattern suggests a 10% price rise, setting an exit point near this target prevents greed from eroding gains. This approach fits well in Pakistan's markets, where sudden corrections can be common due to news or economic shifts.
Position sizing for Pakistani market conditions means adjusting trade size according to market liquidity, personal risk tolerance, and capital. Since many stocks in Pakistan have low volumes or may face loadshedding impacts on trading hours, smaller position sizes reduce risk exposure. Using a fixed percentage of your trading capital per trade, such as 1-2%, keeps emotions in check during uncertain movements.
Effective use of chart patterns isn't just spotting shapes but integrating confirmation tools and managing risk smartly, especially in Pakistan's dynamic financial markets.
In practice, combining these elements sharpens your strategy, helping you make better-informed decisions rather than relying on patterns alone.
Finding trustworthy books and PDFs on chart patterns plays a key role in sharpening your technical analysis skills. The quality of your study material directly impacts how effectively you can identify price movements and make informed trading decisions. In Pakistan’s competitive markets — be it PSX shares, forex, or crypto — having access to well-written and reliable resources ensures that you avoid costly misinterpretations.
Classic titles recognised internationally offer foundational knowledge that traders worldwide rely on. Books like Thomas Bulkowski’s "Encyclopedia of Chart Patterns" or John J. Murphy’s "Technical Analysis of the Financial Markets" have stood the test of time for their clear explanations and practical case studies. These books cover essential patterns with examples from different markets, helping you understand signals that apply globally, including in Pakistan. Their detailed approach lets traders comprehend the nuances, such as volume confirmation and breakout validation.
Books by Pakistani authors or local experts add a valuable layer of contextual understanding. Since these authors are familiar with the Pakistani market's unique behaviour, regulations, and volatility, their insights often address local quirks absent in international texts. For example, guides written by seasoned Pakistani traders may cover topics like working with the State Bank of Pakistan's monetary policies effect or the impact of political news on PSX patterns. Such books are practical for those looking to fine-tune strategies specific to Pakistan’s environment.
Where to buy or borrow these books matters too. Major cities like Karachi, Lahore, and Islamabad have bookstores that stock international trading books, and local publications often feature in these shops. Additionally, libraries in universities offering finance courses or local stock brokerage offices sometimes provide access to both classic and Pakistani market-based books. For those without easy access, online Pakistani retailers or second-hand shops often sell these books at reasonable prices.
Trusted websites for PDFs about chart patterns include platforms that specialise in financial education, trading forums, and official financial institutions. While many PDFs available may be free, credible sites ensure you are getting accurate, well-structured content rather than random uploads. For example, downloading a PDF of a Pakistani expert's seminar notes or a detailed guide from a local broker’s official website can be very useful.
Cautions about copyright and authenticity are important to consider. Many PDFs circulating online may be unauthorised copies, lacking updates or proper context. Using such materials might lead to outdated or incorrect interpretations of chart patterns. Always prefer PDFs from verified sources or those shared by recognised traders to ensure the material's reliability.
Useful downloadable materials for traders in Pakistan often include market-specific reports, tutorials, and pattern libraries that blend global concepts with local market realities. PDFs that explain SBP policy rate changes affecting forex charts, or seasonality effects within the PSX, help traders connect pattern signals with actual market events. Such tailored PDFs give Pakistani traders an edge in understanding how chart patterns relate to their everyday trading scenarios.
Access to reliable books and PDFs is not just about learning; it is about building confidence to spot profitable opportunities and avoid pitfalls in Pakistan’s dynamic markets.
By carefully selecting and using these resources, traders and investors can enhance their analysis skills and navigate Pakistan’s financial markets with greater precision.
Learning chart patterns swiftly can significantly boost your trading or investing success. Rather than just reading about patterns, applying them practically brings understanding to life and builds confidence for real trades. In Pakistan's market, where volatility and local factors matter, practical skill is especially valuable. This section highlights ways to speed up your learning through the right tools and community support.
Platforms like TradingView, MetaTrader offer powerful tools for spotting and analysing chart patterns. TradingView is popular for its intuitive interface and wide range of indicators, with many Pakistani traders using its free and paid plans. MetaTrader meanwhile is staple software for forex traders, offering real-time charts and automated trading features. Using these platforms daily helps sharpen pattern recognition and timing for entry and exit points.
Local brokerage tools offering charts provide another practical edge. Many Pakistani brokers now integrate interactive charts directly on their platforms, which means you can analyse market movements and patterns without switching between software. For example, brokers like Foundation Securities and IGI Securities offer user-friendly chart tools customised for PSX trading. This integration saves time and lets you react faster to market moves.
Utilising mobile apps for on-the-go analysis is essential for traders who can’t stay glued to desktops. Apps like TradingView’s mobile version, MetaTrader mobile, and local brokerage apps allow monitoring and confirming chart patterns anytime, anywhere. This flexibility is handy when PSU employees, students, or business owners must manage trades between daily tasks, especially when fast decisions are needed during sudden market changes.
Sharing ideas and getting feedback in trading groups can accelerate learning. Pakistani traders active on Facebook groups, WhatsApp chats, and Telegram channels exchange chart patterns, discuss setups, and correct mistakes. Getting real-time feedback reduces the chance of sticking to wrong assumptions and helps refine your analysis through diverse perspectives.
Webinars and workshops in Pakistan organised by brokers and trading academies offer structured learning with expert guidance. These sessions often focus on Pakistani markets, covering local conditions, regulations, and best practices for chart pattern application. Participating in such events sharpens skills substantially and can expose you to insider tips.
Learning from experienced traders’ insights is priceless. Pakistani market veterans often share nuances of chart patterns that books miss, such as how monsoon season affects market trends or how political developments influence breakouts. Engaging with these experts through mentoring or online interviews helps apply theoretical knowledge practically and with cultural context.
Regular practice using reliable charting software along with active community involvement provides the fastest route to mastering chart patterns in Pakistan’s dynamic market.
This combination of tech use and community learning helps transform theory into confident trading decisions tailored to Pakistani market realities.
📊 Learn key chart patterns in trading with our detailed guide! Understand pattern types, their trading impact, plus get useful PDF resources for practice. 📈
Learn to spot 7 key chart patterns in trading 📈. Understand their traits, signals, and impacts with a handy PDF guide perfect for every trader in Pakistan.
📈 Master 35 key candlestick patterns in trading with our easy guide! Learn to read charts and make smarter trades. Bonus: downloadable PDF included! 📊
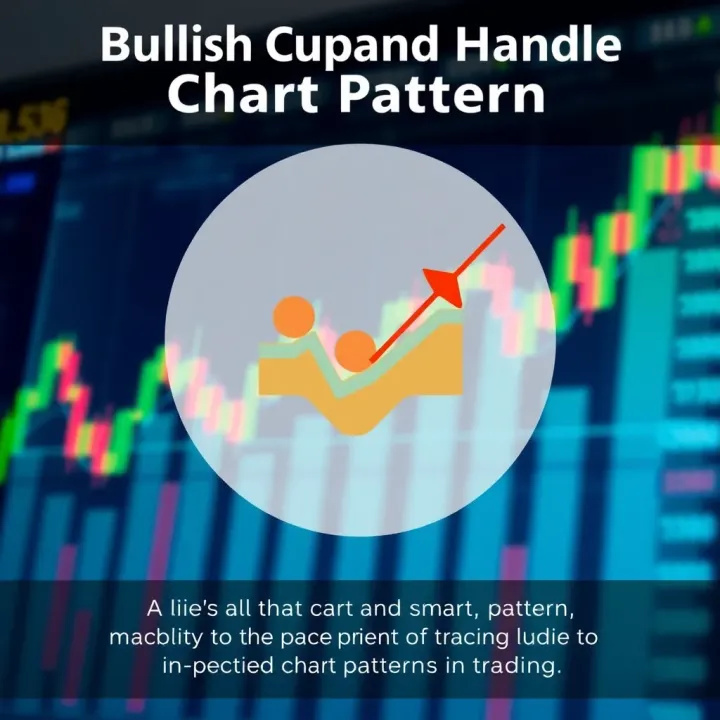
📊 Master key chart patterns to spot market trends, optimize entries & exits, and boost your trading strategy with practical tips and risk management.
Based on 10 reviews