
Bearish Candlestick Patterns Explained
📉 Learn to spot bearish candlestick patterns to detect market weakness and smartly time your trades. Practical tips for better trading decisions.
Edited By
Oliver Morgan
Understanding candlestick patterns is like getting the secret menu at your favorite diner — it’s powerful stuff once you know the codes. Whether you're trading stocks on the Pakistani market or dabbling in Forex across global scenes, these patterns can seriously up your game. They’re more than just lines and colors on a chart; they tell stories about market psychology, price action, and potential moves.
In this guide, we’ll break down the most useful and impactful candlestick patterns you need to watch out for. From the simple dojis to complex morning stars, each pattern gives you clues about where prices could head next. Plus, we've included a handy PDF resource that lists 35 essential patterns to keep on hand for quick reference.
Don’t underestimate the power of recognition — spotting the right pattern at the right time can save you from losing trades and help lock in profits faster.
Whether you’re a rookie curious about how chart reading works or a seasoned trader wanting to sharpen your eyes, this article tackles it all. By the end, you’ll feel more confident interpreting price movements and making solid trading calls based on proven candle formations.
Let’s get started, and see how these patterns can become your new best friends in trading!
Candlestick patterns are a fundamental part of technical analysis, especially for traders and investors looking to get a grip on market moves. They offer simple yet powerful visual clues about price behavior, revealing shifts in market psychology that often precede actual price changes. This section sets the foundation by breaking down what these patterns are and why they’re so widely used, especially in markets like stocks, Forex, and cryptocurrencies.
For example, Pakistani traders often face volatile markets; knowing candlestick patterns can help them anticipate price changes better than just relying on numbers or volume alone. Understanding these patterns not only sharpens decision-making but also helps to time entry and exit points more precisely.
Candlestick charts were invented by a Japanese rice trader named Munehisa Homma in the 18th century. He realized traders’ emotions—like fear and greed—affected rice prices and found a way to visualize these feelings through price movements. This method was revolutionary because it didn’t just show price level changes but also the story of the trading day.
Today, these charts are used worldwide for various assets. Their ability to summarize complex price data into a clear, intuitive form makes understanding market sentiment easier. Traders can see if bulls (buyers) or bears (sellers) are dominating. For instance, if you watch the Karachi Stock Exchange, candlestick charts help you interpret quickly whether the demand will push prices up or if supply will drag them down.
A single candlestick displays four key pieces of data from a specific time period: the opening price, closing price, highest price, and lowest price. The body of the candle represents the range between open and close. If the close is above the open, the candle is usually green or white, signifying a bullish move. If the close is below the open, it’s often red or black, showing a bearish market.
The thin lines above and below the body are called wicks or shadows. These indicate the high and low prices within that period. A very long wick at the top, for example, means sellers pushed the price down from the high, suggesting resistance.
To put it plainly: if you see a candle with a small body but long shadows, it tells you the market was undecided during that timeframe — the battle between buyers and sellers was intense but inconclusive.
Compared to line charts, which simply connect closing prices, candlestick charts pack much more info into a single picture. Unlike bar charts, which can look cluttered, candlesticks provide a cleaner, immediate way to spot trends and reversals.
For traders in Pakistan’s fast-moving markets, this quick insight can mean the difference between capitalizing on a breakout or missing the move altogether. Moreover, candlesticks are visual — making them easier to interpret at a glance compared to numeric data alone.
Candlestick patterns reveal the tug of war between bulls and bears in a way words or numbers just can’t capture. For example, a "hammer" pattern shows buyers stepping in after a sell-off, hinting that the downtrend might be losing steam. Conversely, a "shooting star" signals selling pressure after a strong uptrend, possibly warning of a reversal.
This visual clarity helps traders understand whether optimism or fear dominates, which guides better decisions without needing to crunch lengthy data sets.
One major advantage of candlestick analysis is spotting when trends may turn around or keep going. Patterns like the "engulfing pattern" are clues that the current market direction might flip, while others like "three white soldiers" point to ongoing strength.
Traders use these hints to plan their moves. For instance, if you see an evening star at the top of an uptrend on the PSX, it might be a green flag to book profits or tighten stop-loss orders.
Timing can make or break a trade. Candlestick patterns help refine that timing by signaling moments when the price action confirms a trend or warns of a change. This is especially important in volatile markets where waiting too long can wipe out gains.
Imagine you’re trading Forex during active hours; spotting a bullish engulfing pattern right at a support level can boost confidence to enter a trade earlier, not waiting for further confirmation that might not come.
Remember, no tool alone guarantees success, but combining candlestick patterns with sound risk management and other indicators is a practical approach welcomed by many experienced traders worldwide, including those in Pakistan.
Understanding these basics sets you up for learning more advanced patterns and how to weave them into your trading strategy effectively.
Understanding candlestick charts goes beyond just looking at pretty colors and shapes. It’s about reading what the market is telling you at a glance. This section digs into the core components that make up each candlestick, laying the foundation for spotting patterns that traders rely upon. When you can interpret these elements clearly, you’ll get a better feel for price action and market sentiment, which helps you make smarter trade decisions.
Every candlestick summarizes four key price points within its timeframe: the open, close, high, and low. Think of it like a snapshot of market activity during that period. For example, in a 15-minute candle on the PSX, the open is where price started, the close is where it ended, and the high and low show the extremes.
Knowing the exact open and close helps you understand whether buyers or sellers dominated. If the close is higher than the open, buyers were stronger during that interval — this often signals bullish momentum. Conversely, a lower close suggests selling pressure.
This concise info lets traders see price direction and volatility quickly. Many beginners miss how the wicks (we'll touch on these next) tell stories too; they reveal price rejection points and hesitation.
The candle’s body, the thick part between open and close, represents the net price movement for the timeframe. A long body typically indicates strong momentum in one direction — either buyers pushing upward or sellers pressing down. A small or narrow body means indecision or a balance of forces.
For instance, if you spot a long green (bullish) body on the KSE-100 index chart after a downtrend, it might hint at buyers stepping in convincingly. Traders often combine this clue with volume spikes to confirm strength.
Pay attention to body size because it’s a simple, visual way to gauge momentum and can offer early signals before patterns fully develop.
The thin lines extending above and below the body are called wicks or shadows. They represent the highest and lowest prices traded during the session but where price didn’t settle.
A long upper wick means sellers pushed back hard to prevent prices from rising further, showing resistance. Conversely, a long lower wick indicates buyers defended a lower level, suggesting support.
For example, a candlestick with a small body but a long lower wick on the Pakistan Stock Exchange's textile sector stock might suggest buyers rejecting lower prices, a possible bullish sign.
Ignoring wicks would be like hearing only half the story. They highlight where the market tested extremes but decided to reverse or pause, and these details are essential when confirming patterns.
Colors help your brain pick up quickly who won the fight between bulls and bears during a session. Traditionally, green or white candles signify bullish momentum where the close is higher than the open. Red or black candles indicate bearish momentum, where the close is lower.
While some traders use different colors, the main goal is clarity. Seeing a sudden blast of green candles on Pakistan’s oil sector stocks after news of policy change can immediately tell you buyers are running the show.
Keep in mind, color conventions are just visual aids—they don’t replace understanding the price action itself.
Different charting platforms like MetaTrader or TradingView let you customize candle colors. Choosing colors that are easy on your eyes and contrast well against the background can reduce mistakes, especially during fast market moves.
For Pakistani traders juggling multiple charts, setting a distinct color scheme for bullish and bearish candles helps avoid confusing signals. Some even use extra colors to denote neutral candles or special sessions.
The trick is to pick a setup that feels intuitive so your eyes immediately catch critical shifts without second-guessing.
Remember, the primary goal is reading market sentiment swiftly. Colors should enhance this clarity, not distract you.
By grasping these key candlestick elements—the open, close, highs, lows, candle body, wicks, and color conventions—you gain essential tools for interpreting price action. This understanding forms the base for recognizing patterns that signal potential trades and managing risks effectively.
Understanding the categories of candlestick patterns is like sorting tools in a toolbox before fixing something. Each pattern tells a story about market sentiment and helps traders anticipate price moves. These categories mainly split into single-candle patterns and multiple-candle patterns, and knowing the difference is crucial for interpreting charts effectively.
Single-candle patterns give quick snapshots of market sentiment from just one trading session. These are handy when you want to catch a potential turning point without wading through a long string of candles. Meanwhile, multiple-candle patterns provide a broader narrative by showing how price action evolves over a sequence, offering stronger evidence for trend continuation or reversal.
Categorizing patterns properly lets traders pick up signals confidently and avoid jumping to conclusions based on incomplete data.
These two look strikingly similar — both have small bodies near the top with long lower shadows — but their meanings shift dramatically depending on their context in the trend. A Hammer appears after a downtrend and signals a possible bullish reversal; it’s as if buyers stepped in late to save the day. Conversely, a Hanging Man shows up after an uptrend and warns that selling pressure could be building, potentially foreshadowing a bearish reversal.
The key takeaway here is their location in the chart. Spotting a hammer at the bottom of a sell-off may hint that the curtain is about to close on the bearish move, making it a handy stop for traders looking to enter long positions.
Both the Doji and Spinning Top are about indecision. When these candles show up, it often means buyers and sellers are wrestling for control but neither side managed a decisive win during the period. A Doji stands out for its almost identical open and close prices, creating a cross-like figure, while Spinning Tops have slightly larger bodies but still small compared to their wicks.
Recognizing these can help traders gauge moments when the market might pause or reverse. For instance, a Doji after a strong trend often warns traders to prepare for potential pullbacks or sideways moves.
An Engulfing pattern involves two candles where the second candle completely engulfs the body of the previous one. The Bullish Engulfing occurs when a small bearish candle is followed by a larger bullish candle, signaling growing buying interest. Conversely, the Bearish Engulfing starts with a small bullish candle overtaken by a larger bearish candle, hinting that sellers are gaining strength.
This pattern’s strength lies in its clear shift of momentum. For example, seeing a Bullish Engulfing near a support level can boost confidence in opening long trades, while Bearish Engulfing near resistance might prompt taking profits or short entries.
These are classic three-candle reversal patterns. A Morning Star forms after a downtrend and forecast a bullish reversal — it starts with a long bearish candle, followed by a small-bodied candle (which can be a Doji or Spinning Top), and finishes with a large bullish candle closing well into the first candle’s body. The pattern signals hesitation and then shift in sentiment, like a slow-moving dawn after darkness.
The Evening Star is its bearish counterpart, showing up after an uptrend to warn that buyers might be losing steam. Spotting these patterns can be a game-changer if paired with other confirmations like volume spikes or support/resistance zones.
These patterns signal strong trend continuation. The Three White Soldiers consist of three consecutive long bullish candles opening within the previous candle’s body and closing progressively higher. This pattern shows buyer dominance over several sessions, reinforcing an ongoing uptrend.
On the flip side, the Three Black Crows are three bearish real-body candles with each opening within the previous body and closing lower, signaling sellers are firmly in control.
Recognizing these patterns helps traders avoid premature exits by confirming trend direction and strength. For example, seeing Three White Soldiers after a correction could encourage holding onto longs or adding to positions.
By breaking candlesticks into these categories and understanding their formation and context, traders can make smarter calls in the heat of the market. Keep in mind, no pattern works in isolation — combining these with other indicators increases your odds of success, especially in dynamic markets like KSE or Forex traded from Pakistan.
Interpreting candlestick patterns is more than just spotting shapes on a chart—it's about understanding what these shapes say about market psychology and future price movement. The 35 powerful candlestick patterns we focus on provide traders with signals that help anticipate shifts in supply and demand dynamics. Traders in Pakistan, for example, can find these patterns particularly critical given the local market's volatility and the prominence of Forex and stock trading.
By learning to recognize these patterns accurately, traders gain an edge in timing their trades better, spotting early warnings of trend reversals or continuations. This section outlines the practical significance of reading these patterns—not as standalone signals but in conjunction with other market data—to improve decision-making and risk management.
Bullish reversal patterns tell you when a downtrend might be losing steam, offering the possibility of an upward price move. A classic example is the Hammer pattern, where the candle has a small body and a long lower shadow, signaling that sellers pushed prices down but buyers regained control by close. Another commonly seen pattern is the Morning Star, which consists of three candles: a large bearish candle, a small-bodied candle that gaps down, and then a large bullish candle closing well into the first candle’s body.
Understanding these patterns helps traders act confidently to enter long positions or tighten stop-loss orders on shorts. Imagine a Forex trader noticing a Morning Star on the USD/PKR chart after a steep decline—this could signal a good entry point for a bullish trade, especially if paired with rising volume.
On the flip side, bearish reversal patterns warn that an uptrend might be ending, pointing to potential selling opportunities. The Shooting Star is a useful pattern here; it has a small body, long upper shadow, and indicates that buyers pushed prices up sharply but sellers brought them back down near the open. The Evening Star pattern resembles the Morning Star but in reverse order, signaling a trend top formation.
Spotting these signals can save traders from holding onto long positions for too long or prompt initiating shorts in anticipation of a downturn. For example, noticing an Evening Star pattern on the Pakistan Stock Exchange after a bullish run can be an alert to review your positions closely or prepare a sell strategy.
Sometimes the market just takes a breather before moving further in the same direction. Continuation patterns confirm that the trend isn’t done yet. For instance, a Bullish Marubozu candle with no shadows usually means strong buying interest and trend continuation. Likewise, the Three White Soldiers pattern—three consecutive long bullish candles—shows persistent buying pressure.
Traders use these signals to hold onto positions and potentially add to them, avoiding premature exits when the trend is still alive. A Pakistani equity trader seeing Three White Soldiers forming on a tech stock may decide not to sell just yet, recognizing momentum is building.
Flags and pennants are especially useful in spotting short pauses in a sharp trend before it resumes. A flag looks like a small rectangle slanting against the prevailing trend after a steep price move, while pennants form small triangles. Both patterns are continuation signals often followed by strong moves in the original trend’s direction.
These patterns are practical because they provide traders clues on when a temporary break in price movement is over. For example, in Forex, after a rapid appreciation of USD/PKR, if a flag pattern forms, it often hints the USD may continue to rise after the brief consolidation.
Recognizing these candlestick signals—whether warning of a possible turnaround or confirming a persistent trend—is key to navigating market ups and downs with confidence.
By blending candlestick reading skills with other analysis factors like volume or support levels, Pakistani traders can sharpen their timing and improve trade outcomes significantly.
Candlestick patterns form an essential piece of the puzzle in crafting effective trading strategies. They're not standalone signals but work best when combined with other analysis tools, helping traders, especially in the dynamic Pakistani market, make smarter entry and exit decisions. Integrating these patterns into your strategy can provide a clearer picture of market behavior, reduce guesswork, and enhance your risk management.
Moving averages smooth out price data to help identify the direction of the trend. When candlestick patterns occur near significant moving averages—like the 50-day or 200-day simple moving average—they carry more weight. For instance, a bullish engulfing pattern forming just above the 50-day moving average could signal a strong upward move. Traders often watch for crossovers where shorter-term averages cross above longer-term ones combined with candlestick signals to confirm trend shifts.
Volume adds depth to candlestick signals by revealing trader participation. A hammer pattern with high volume, for example, often points to a serious reversal rather than a random blip. Likewise, when engulfing patterns coincide with rising volume, it confirms growing momentum. Volume spikes alongside candlestick patterns can act as a green light, suggesting that the move has broader market backing and might be more reliable.
Candlestick patterns pop up around key support and resistance zones frequently. A shooting star near a resistance level might warn traders of a looming pullback, while a morning star pattern near support might hint at the start of a bounce. Recognizing these zones helps filter false signals and improves timing. It's common practice to set alerts around these levels and watch for candlestick confirmations before making a move.
Risk control is king, and stop-loss orders based on candlestick patterns provide a straightforward way to cap potential losses. For example, after spotting a bullish engulfing pattern, placing a stop-loss just below the candle's low can prevent big hits if the market flips. This technique aligns your risk appetite with the technical signal, creating a safety net without stifling potential gains.
Proper position sizing complements pattern recognition by managing how much capital is exposed. Even if a perfect morning star appears, risking half a typical position might be wiser in volatile markets like Pakistan’s. This way, you preserve trading capital to withstand unexpected moves. Many seasoned traders adjust position sizes dynamically, depending on the reliability of the candlestick pattern and market conditions, ensuring no single trade can derail their portfolio.
Using candlestick patterns wisely within a well-rounded strategy isn't about chasing every signal but about confirming setups, managing risks, and staying disciplined with entries and exits.
In short, candlestick patterns become more powerful tools when combined with moving averages, volume data, and critical price levels while maintaining solid risk management. This integrated approach lays the foundation for smoother trades and a better chance at long-term success.
Having a handy reference like the 35 Powerful Candlestick Patterns PDF is a game-changer for traders and investors. It acts like a quick-access toolkit that helps you identify important price movements without scrambling through charts every time. For those trading in stocks, forex, or crypto, this PDF isn’t just a list—it's a visual guide and a learning aid rolled into one, making it easier to sharpen your pattern recognition skills.
The PDF provides clear, color-coded images of each candlestick pattern, which is super useful for recognizing them on live charts. For example, when you see a Hammer pattern in the PDF, you’ll spot exactly how the candle looks in terms of wick length and body size. This visual familiarity is crucial because reading patterns isn’t just about memorizing names; it’s about quickly spotting formations in real-time.
Think about it like this: if you’re uncertain whether a candlestick is a Doji or a Spinning Top, the side-by-side visuals in the PDF let you compare them instantly. It’s also like having a mini-guidebook on your device or printout, so you’re less likely to mix up similar-looking patterns during hectic market hours.
Each pattern in the PDF comes with a straightforward description that covers what it signals—whether a trend might reverse or continue—and why it matters. For instance, the Engulfing pattern's explanation clarifies that a bullish engulfing suggests strong buying pressure after a downtrend. These descriptions also often include tips on confirming the pattern with volume or other indicators.
By understanding not just what the pattern looks like but what it means in market terms, you can make smarter trading decisions. The PDF also warns about common pitfalls, such as fakeouts, helping you avoid jumping into trades too early.
Getting this PDF should be simple. Typically, you’d find a clear call-to-action on a trusted financial education platform or broker’s website dedicated to candlestick education (like Investopedia or BabyPips). Once you locate the download button:
Click it and choose to save the file in an easy-to-remember folder.
Make sure your device supports PDF viewing, whether with Adobe Acrobat or another reader.
If you’re on mobile, apps like Google Drive or Apple Books work great for opening and zooming in on the patterns.
Always be cautious not to download from sketchy sources to avoid malware. Stick to reputable platforms known for financial resources.
Studying these patterns requires a hands-on approach. Print out the PDF or keep it readily available on your tablet or phone, then dedicate time to review it alongside your live charts. Here’s a practical way to use it:
Start by focusing on just a few patterns daily instead of all 35 at once.
Watch for these patterns in different markets — sometimes a Morning Star on the Pakistan Stock Exchange looks slightly different than on forex pairs during volatile hours.
Use the PDF descriptions to question your trades: "Does this pattern suggest I should wait for confirmation? What’s the volume telling me?"
Remember, the PDF is a guide, not a crystal ball. Always mix pattern recognition with other analysis tools and risk management.
Regularly revisiting the PDF will make these candlestick patterns second nature. Over time, this boosts your confidence in spotting timely entries and exits, which can significantly improve your trading outcomes.
In summary, the 35 Powerful Candlestick Patterns PDF is a practical toolkit for serious traders — offering visuals and insights to help you trade more systematically and avoid guesswork. With careful downloading and consistent use, it becomes a cornerstone resource in your trading arsenal.
Traders in Pakistan face unique market conditions, so adapting candlestick patterns to the local context is essential. From volatility shifts during major political events to specific market hours, understanding these nuances can make candle pattern analysis more reliable. This section sheds light on pragmatic approaches tailored for Pakistani markets, helping traders avoid common pitfalls and sharpen their edge.
Pakistani markets can swing wildly, especially around budget announcements, political drama, or global shocks hitting emerging economies. This ups and downs often distort the typical candlestick signals from international markets. For example, a hammer pattern in the Pakistan Stock Exchange might appear more frequently but doesn’t always point to a reversal due to rapid sentiment shifts.
It's smart to combine candlesticks with volatility indicators like the Average True Range (ATR) or Bollinger Bands adapted to Karachi Stock Exchange timing. This helps confirm whether a pattern truly signals a meaningful move or just noise. Keep an eye on news around election cycles or geopolitical tensions, as these periods usually ramp up volatility significantly.
Pakistan’s market hours (generally 9:30 AM to 3:30 PM PKT) affect how patterns form. Day traders benefit most from 5-minute to 15-minute charts since they capture the fast-moving action. Swing traders might lean towards 1-hour or daily charts that smooth out intraday noise but still respect local session timings.
Outside these hours, patterns noted on, say, a 4-hour chart may blend in global influences from markets like Dubai or London. So it’s valuable to cross-check with session-specific timing to avoid mixed signals. For instance, candlestick patterns forming just before market close often reflect last-minute order flows rather than genuine trend shifts.
Pakistani traders often prefer platforms that offer both local and international market data with robust candlestick charting features. MetaTrader 5 is popular among Forex and commodity traders because it integrates local brokers and has plentiful indicator options.
For stock traders focused on the Pakistan Stock Exchange, software like TrendSpider or TradingView is gaining traction due to their intuitive interface and extensive candlestick pattern libraries. These tools allow easy customization of color schemes and alert setups, helping traders spot patterns even during hectic trading days.
Given the rapid pace of trading and the ubiquity of smartphones, mobile apps are vital for Pakistani traders. Apps like MetaTrader 4/5 and Investing.com mobile app provide live Pakistan market data with full candlestick visuals.
Another contender is the Binomo app, popular for its straightforward charts and pattern recognition alerts, though it's geared more toward options trading. The Pakistan Stock Exchange’s official app also includes basic candlestick charts and news updates.
For on-the-go candlestick analysis, ensure your chosen app supports zooming in on candle details and offers the ability to overlay multiple indicators. This real-time insight can make a world of difference, especially during volatile local trading sessions.
Remember, no tool or pattern works in isolation. Combine technical analysis with local market knowledge for stronger trading decisions.
Understanding candlestick patterns is a great skill, but many traders stumble not because the patterns are hard, but because they misapply them or overlook key details. Recognizing common pitfalls can save a lot of headaches and prevent unnecessary losses, especially for newcomers or those trading in volatile markets like Pakistan's KSE-100 or the Forex pairs popular locally.
Candlestick patterns on their own tell only part of the story. One of the biggest mistakes traders make is ignoring other important factors like volume and overall trend confirmation. For instance, spotting a bullish engulfing pattern is exciting, but if it happens on ultra-low volume or against a strong downtrend, the signal might not hold up. Volume acts like the crowd’s voice—low volume means less conviction, high volume suggests genuine interest.
Trading without a plan also leads to trouble. Jumping on a pattern without knowing where to enter or exit, or how much risk to take, is a recipe for chaos. Successful traders always have a plan that includes stop-loss levels and profit targets based on the pattern and additional market clues. Without this framework, it’s like sailing without a map—you might get lucky, but most likely you’ll get lost.
Some candlestick shapes look alike but carry different meanings, and that’s where many traders go wrong. A great example is the Doji. You have various types—like the dragonfly Doji, gravestone Doji, and long-legged Doji—and mixing these up can lead to wrong trading decisions. The difference lies mainly in the wick lengths and where the opening and closing prices sit, which signal different market indecisions or potential reversals.
Avoiding false signals is crucial too. Not every pattern that looks bullish or bearish really means a trend change. For example, a hammer candlestick after a long downtrend can seem like a buy sign, but if it appears after heavy news-driven volatility and the next candles don't confirm the bounce, it’s safer to hold off. Confirmation from following candles and volume is key to filter out such noise.
Understanding these common errors helps you not just learn candlestick patterns, but to use them wisely within the bigger picture of trading strategies. It’s not just about spotting a pattern but knowing what it really means in context.
By keeping an eye on these mistakes, you sharpen your trading skills and reduce the guesswork often involved in interpreting market moves. That way, your analysis becomes more reliable and your trading decisions more confident.
Wrapping up a guide on candlestick patterns is not just about summarizing; it’s about setting you up for the next phase: hands-on mastery. Candlestick trading is a tool, and like any tool, its value comes from how well you wield it. Understanding patterns is a strong first step, but mastering their use alongside other market insights makes all the difference.
Through this article, you’ve seen various candlestick patterns and how they reflect market psychology. Now, moving forward, it’s vital to practice these concepts actively and integrate them with broader analysis techniques. Let’s break down what that means in practical terms.
Paper trading is essentially practice trading without real money—it’s like flying a plane in a simulator before piloting the real deal. This approach allows you to test out candlestick patterns and trading strategies without risking your capital. For instance, you might observe how a Morning Star pattern plays out in a volatile stock like Pakistan’s K-Electric before jumping in with real money.
This method highlights your strengths and weaknesses, building confidence and helping avoid costly mistakes. The key is to treat paper trades seriously—log your decisions, the reasoning behind them, and outcomes. Over time, this will sharpen your pattern recognition and trade execution skills.
Keeping a detailed trading journal is more than just jotting down your trades. It’s about tracking emotions, market conditions, entry and exit points, and the outcome of the trade. Think of it as a diary that tracks your growth as a trader.
A journal lets you spot recurring mistakes or successes related to specific candlestick patterns. Say you notice that your trades following a Bearish Engulfing pattern tend to fail when the trading volume is low—that’s invaluable insight to refine your strategy. Aim to write down your trades daily, noting the context and what you’ve learned.
Candlestick patterns don’t exist in a vacuum. Combining them with fundamental analysis is like adding salt to a recipe—it enhances the flavor and gives better results. For example, if a bullish candlestick pattern emerges on the shares of a Pakistani textile company, cross-checking this against quarterly earnings or political stability in the region can confirm if the trend is worth following.
Fundamental analysis adds depth to your decisions, ensuring you're not chasing patterns blindly. It’s especially critical in markets like Pakistan’s, where economic events or news can cause sharp price swings, sometimes invalidating technical signals.
Keep your finger on the pulse of economic updates because markets react fast to news. Watching announcements like Pakistan’s State Bank policies, inflation reports, or major export figures can provide context to the candlestick signals you’re interpreting.
A candlestick pattern signaling a reversal might fail if big economic news contradicts it. For example, a bullish pattern might appear right before a sudden interest rate hike, which generally sends prices down.
To be a smart trader, combining technical patterns with real-world events is a must. Stay informed, stay cautious, and always aim to connect the dots.
This two-pronged approach, blending continuous practice with solid market analysis, will help you grow from recognizing candlestick patterns to using them as reliable guides in your trading decisions. Remember, no system is perfect, but consistent learning and discipline turn the odds in your favor.
📉 Learn to spot bearish candlestick patterns to detect market weakness and smartly time your trades. Practical tips for better trading decisions.
📈 Master 35 key candlestick patterns in trading with our easy guide! Learn to read charts and make smarter trades. Bonus: downloadable PDF included! 📊
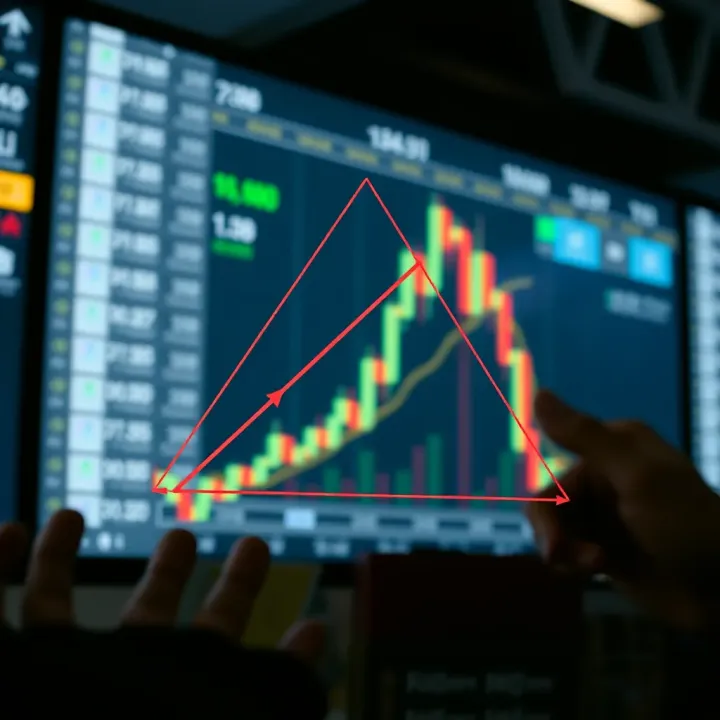
📊 Master key chart patterns to spot market trends, optimize entries & exits, and boost your trading strategy with practical tips and risk management.
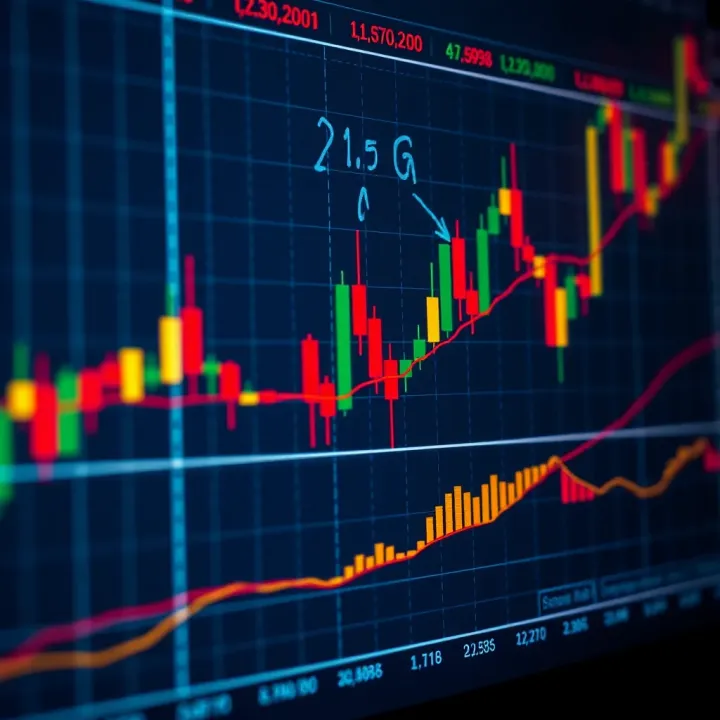
🔍 Explore key candlestick patterns to master price moves. Learn single & multiple formations, tips to read signals, and smart combo with indicators!
Based on 9 reviews