
Bearish Candlestick Patterns Explained
📉 Learn to spot bearish candlestick patterns to detect market weakness and smartly time your trades. Practical tips for better trading decisions.
Edited By
Emily Clarke
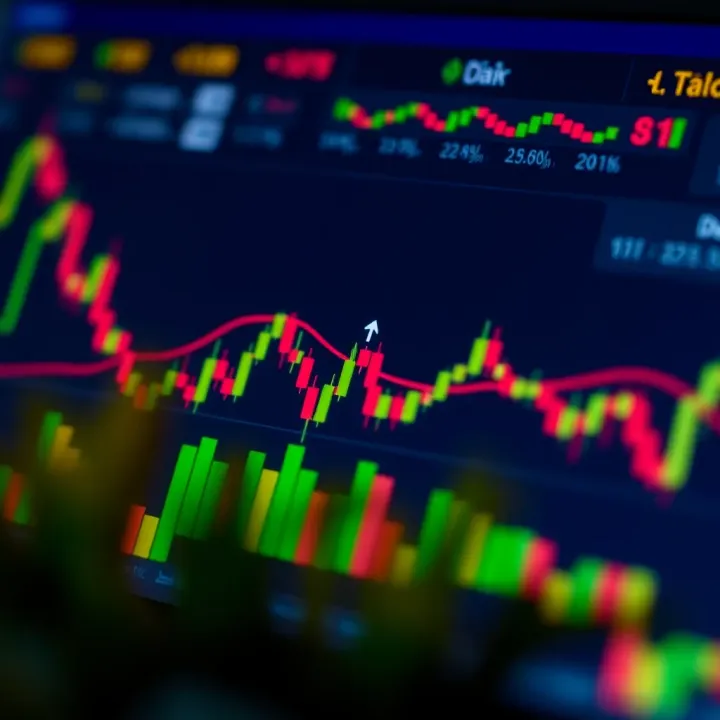
Candlestick patterns are an essential part of technical analysis in trading. They provide a visual insight into market sentiment by showing price movements over a set period. Understanding these patterns helps traders spot potential reversals or continuations in the market, giving them a valuable edge.
Candlesticks consist of a body and wicks (or shadows). The body shows the opening and closing prices, while the wicks reflect the high and low values during the session. If the closing price is higher than the opening, the candlestick is bullish — indicating upward momentum. Conversely, a bearish candlestick shows a close lower than the open, signalling downward pressure.
For traders in Pakistan’s stock and cryptocurrency markets, recognising these patterns allows for smarter timing when entering or exiting positions. For example, during periods of loadshedding-linked uncertainty, spotting a bullish engulfing pattern might indicate a strong appetite to buy despite broader economic worries.
Candlestick patterns do not guarantee market direction but offer clues that, combined with other tools like volume analysis and support/resistance levels, aid in making informed decisions.
Some key factors to keep in mind:
Timeframes matter: Patterns on daily charts carry more weight than those on 5-minute charts.
Market context: A bullish pattern in a longer-term downtrend might just be a short bounce.
Confirmation: Look for follow-through in subsequent candles before acting.
In summary, mastering bullish and bearish candlestick patterns forms a solid foundation in reading market trends and improves your ability to react swiftly to changing market conditions. This makes them indispensable tools for traders aiming to enhance their investment results in Pakistan’s financial markets.
Candlestick charts are fundamental tools in trading that provide a clear visual representation of price movements over a specific time frame. Unlike line charts, candlesticks capture four critical price points: open, close, high, and low. This makes them invaluable for traders seeking to understand market dynamics quickly, especially in volatile markets like Pakistan's stock exchange or cryptocurrency platforms.
Each candlestick summarizes trading activity during its time period by showing the open price (where the market started), the close price (where it ended), and the highest and lowest prices reached. For example, on a single day of trading at the Karachi Stock Exchange, a candlestick might show the market opened at Rs 100, rose to Rs 110, dropped to Rs 95, and closed at Rs 105. This data gives a full snapshot of price fluctuations within that trading session.
Understanding these prices is crucial because they tell you not just the end point but the range and volatility. A small difference between open and close might suggest market indecision, while a large gap implies stronger market forces.
The body of the candlestick is the rectangular area between the open and close prices. A long body indicates a larger price move, signalling strong buying or selling pressure. The wick (or shadow) extends from the body to highlight the highest and lowest prices during that period.
For instance, if a candlestick has a long lower wick but a small body near the top, it suggests buyers pushed prices up after a downward move, showing strong support. Traders use these hints to judge if the market sentiment is changing or stabilising.
Colours help traders instantly identify market direction. Typically, a green or white candle signals bullish sentiment, meaning the price closed higher than it opened. Conversely, a red or black candle indicates bearish sentiment, where the close is below the open.
In Pakistan’s markets, this colour coding helps in quick decision making, especially during fast-paced sessions like the pre-budget rallies or volatile foreign exchange fluctuations.
The size of the candlestick body and wicks communicate the intensity of buying or selling. Large bodies typically show strong market commitment in one direction. For example, a big green candle during an uptrend confirms buyer dominance.
Short bodies combined with long wicks, sometimes called "doji-like" candles, indicate indecision. This often appears before trend changes, so traders keep an eye for such signals to enter or exit trades wisely.
Understanding these basic elements equips traders to read market mood accurately, helping avoid costly mistakes and making informed investment choices amid Pakistan’s dynamic financial landscape.
By mastering the structure and meaning behind candlesticks, you improve your chance of spotting profitable entry and exit points, no matter if you trade stocks, forex, or cryptocurrencies.
Candlestick patterns work as practical signals to understand the current tug-of-war between buyers and sellers. Their appearance often points to possible market direction shifts, helping traders make informed decisions. Recognising whether a pattern leans bullish or bearish informs you about upcoming momentum – whether prices are likely to climb due to buying pressure or fall under selling control.
Bullish patterns suggest that buyers have gained the upper hand, causing prices to bounce back from a dip. This buyer dominance shows confidence in the asset, often after a period of selling or consolidation. For example, after a steady fall in share price, a hammer candle appearing on the chart reflects strong buying near the session's low, signalling a potential price rebound. Such patterns can act as green flags to enter long trades or reduce short positions.
In practical terms, bullish sentiment can develop when positive news emerges, or economic data points to growth. Pakistani traders at the Karachi Stock Exchange may, for instance, spot bullish setups when corporate earnings season surprises on the upside or the rupee stabilises. These patterns translate emotional shifts of market participants into visible chart signs, serving as useful guides.
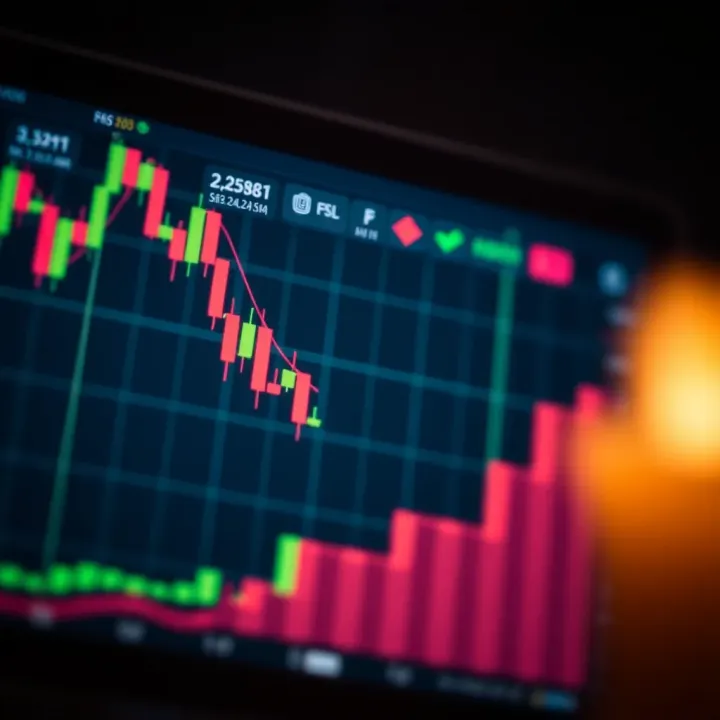
One clear example is the bull engulfing pattern, where a green candle completely covers the previous red candle’s body. This shows buyers overpower sellers within that trading session, hinting at a rising trend. Another example is the morning star pattern, a three-candle formation indicating a strong reversal from downward pressure to upward momentum.
These patterns offer actionable insights, especially in fast-moving markets like Pakistan’s equities or the volatile cryptocurrency segment, helping traders spot buying opportunities early. Recognising such signs before a rally can significantly boost profitability.
Bearish patterns reveal that sellers have taken control, putting downward pressure on prices. When you see these signs, expect potential declines or corrections ahead. For example, a shooting star candle – a small body near session lows with a long wick on top – signals seller rejection of higher prices and warns traders to prepare for drops.
Practically, bearish patterns can indicate an exit point or a good moment to sell. For instance, in the Pakistani commodity markets, if bearish formations appear alongside rising volumes during a price peak, traders might decide to book profits to avoid losses as the trend reverses.
Patterns like the bearish engulfing, where a red candle fully covers a preceding green candle, clearly show that sellers overwhelmed buyers. The evening star pattern, a three-candle setup, also confirms a shift from buying enthusiasm to selling pressure.
Identifying these signs early helps manage risk effectively. Traders using stop-loss orders near bearish signals can lower the chance of sudden losses, making these patterns invaluable tools in preserving capital during unpredictable market phases.
Understanding these candlestick signals allows you to read underlying market sentiment more accurately and time your trades in Pakistan’s dynamic financial markets better.
Bullish candlestick patterns help traders spot potential price rises, offering entry points to benefit from upward trends. Recognising these patterns early on improves your chances of making profitable trades, whether you deal in stocks, forex, or cryptocurrencies on platforms like PSX or Binance Pakistan. Understanding how these patterns form—and what they signify—lets investors make well-informed decisions instead of guessing market moves.
Formation and key features
The hammer forms after a downtrend and looks like a small body with a long lower wick. This shape shows that despite selling pressure pushing prices lower during the trading period, buyers stepped in to close near the opening price. The inverted hammer, meanwhile, has a small body with a long upper wick and appears in a similar spot, signalling buyer hesitation but growing strength.
Using the pattern in trading decisions
When you spot a hammer, it indicates possible support and a price reversal. Traders often wait for the next candle to confirm the trend before entering. For example, if you see a hammer pattern on the 1-hour chart of Lucky Cement, followed by a green candle, you might consider buying with a stop-loss below the wick’s low. The inverted hammer signals a similar possibility but is generally weaker; confirmation becomes even more important here to avoid false signals.
How it forms
The bullish engulfing appears when a small bearish candle is immediately followed by a larger bullish candle that completely covers the previous body. This shows buyers overpower sellers and can mark a strong trend change. For instance, if the Karachi Stock Exchange (KSE-100) index shows this pattern during a corrective pullback, it suggests renewed buying interest.
Significance for entry points
This pattern often serves as a clear prompt to enter a long position. Traders watching their charts for daily or 4-hour timeframes look for the engulfing candle’s close as a signal. Pairing this with volume spikes or RSI moving from oversold levels adds confidence. Managing risk with stop-loss just below the engulfing candle’s low protects against sudden reversals.
Three-candle formation explanation
The morning star consists of three candles: a long bearish candle, a small-bodied candle (could be bullish or bearish) showing indecision, then a large bullish candle closing well into the first candle’s body. This combination reflects a shift from selling to buying pressure.
Confirming an upward trend shift
This pattern is strong confirmation of a potential trend change when found at support levels or after a downtrend. Traders take this as a signal to start buying but smartly wait for the third candle’s close. For example, in Pakistan’s textile stocks, spotting a morning star near historical lows can show buying interest is returning. Using it along with other indicators such as moving average crossover strengthens the trade setup.
Watching bullish candlestick patterns like hammer, bullish engulfing, and morning star helps you identify chances where buyers gain control. When applied carefully with volume and other technical tools, these signals guide smarter trading decisions in Pakistani markets and beyond.
Bearish candlestick patterns play a vital role in signalling potential price reversals or downtrends in trading. Recognising these patterns lets traders act timely to protect profits or enter short positions. The key here is understanding the context, as not all bearish patterns guarantee a drop; they often reflect growing seller pressure and a shift in market sentiment. In Pakistan's markets, where volatility can be influenced by local economic factors, such patterns help traders navigate uncertain moves.
The shooting star and hanging man look similar with small bodies and long upper wicks, but they appear in different contexts. The shooting star forms after an uptrend and hints at a possible reversal; the long wick shows buyers tried to push prices higher but sellers drove them down by close. The hanging man appears following an uptrend but with a long lower wick, reflecting heavy selling during the session even though buyers managed a modest close.
Both patterns warn of weakening bullish momentum. For example, on Pakistan Stock Exchange (PSX), spotting a shooting star on a high-volume day can signal profit-taking by institutional investors, which often precedes a price drop.
The main difference arises from their position and prior trend. Shooting stars indicate rejection at higher prices when bulls lose control; hanging men, despite a similar shape, suggest that sellers appeared suddenly after a rally, testing buyers' resolve. Their presence alone is not enough; confirmation from the next candle (often bearish) matters for deciding action.
For instance, if a hanging man forms but the following candle closes higher, the downtrend signal weakens. Traders should combine these signals with volume data and key support levels prevalent in Pakistan's fast-moving equity or forex markets.
The bearish engulfing pattern consists of a small bullish candle followed by a larger bearish candle that fully covers the previous green body. This shows sellers overturning earlier optimism, pushing prices lower decisively, often signalling trend reversal at key resistance zones.
In Pakistan’s cryptocurrency trading, seeing this pattern near a local top might tempt traders to sell before further declines, avoiding losses during sudden corrections influenced by regulatory news or market sentiment.
Since the bearish engulfing pattern indicates a turn, traders often place stop-loss orders just above the engulfing candle’s high. This helps control risk if the pattern fails to lead to a sustained downtrend. For trading on Daraz or investing in stock market sectors sensitive to political news, acting quickly on this sign helps prevent large drawdowns in volatile periods.
Combining this pattern with other technical indicators like Relative Strength Index (RSI) showing overbought conditions increases confidence in the reversal signal.
The evening star is a three-candle bearish reversal pattern. It starts with a strong green candle, followed by a small-bodied candle that gaps above the previous close, showing indecision. Finally, a large red candle closes well into the first candle’s body, confirming sellers’ control.
This pattern often appears near resistance levels on major indices like the KSE-100, hinting that the bullish trend may be coming to an end.
The evening star’s completion signals mounting selling pressure and often precedes price falls. Traders watching PSX or forex pairs like USD/PKR find this pattern useful to plan exits or short entries. Confirmation with increased volume strengthens the reversal case.
For example, if the evening star forms near a critical psychological level, say Rs 5000 on a major stock, it suggests traders should tighten stop-loss or consider booking profits. Ignoring this pattern could leave investors exposed to a sharper decline, especially during uncertain economic climates with loadshedding and international pressure.
Recognising key bearish candlestick patterns helps traders make timely decisions in Pakistan’s dynamic markets, balancing opportunity and risk effectively.
Shooting Star and Hanging Man warn of weakening bullish sentiment.
Bearish Engulfing pattern signals strong seller control and potential decline.
Evening Star confirms trend reversal with a clear three-candle setup.
Mastering these patterns enables better risk management and more confident trade entries or exits in a variety of market conditions.
Traders in Pakistan’s markets can gain much by combining candlestick patterns with other technical tools to confirm signals and improve decision-making. Using volume alongside price action helps to validate candlestick patterns. For example, a bullish engulfing candle supported by increasing volume suggests genuine buyer interest rather than a shaky price move. Similarly, indicators like the Relative Strength Index (RSI) help to gauge if a stock or asset is overbought or oversold, adding context to candlestick signals. A hammer pattern near an oversold RSI level usually provides a stronger buying opportunity.
Along with technical tools, considering the overall market trend is essential to avoid false signals. Candlestick patterns work best when aligned with the major direction — for instance, spotting bullish reversal patterns during an established uptrend increases their reliability. If the market on the Karachi Stock Exchange (KSE) is generally bullish, traders should be more confident acting on bullish candlesticks. Conversely, patterns against the trend might indicate only short-term blips, not lasting moves.
Using volume and indicators like RSI shows whether a candlestick pattern reflects real momentum. A shooting star pattern losing strength accompanied by rising volume indicates sellers gaining control for a potential drop. RSI readings confirming weakness reinforce bearish signals. Traders overlooking these can fall prey to fake breakouts or pullbacks.
Context within overall market trends means watching where patterns fit in the bigger picture. For example, spotting a morning star pattern during a short-term dip inside an ongoing bullish phase provides a smart entry point. Ignoring trend direction often causes trades against the flow, which tend to fail more often.
Avoiding false signals requires discipline and patience. Candlestick patterns occasionally mislead, especially in choppy markets with low liquidity, like some smaller KSE sectors. Cross-checking signals with other tools and waiting for confirmation, such as a close beyond a key support or resistance, reduces errors. Quick reactions without such safeguards often result in losses.
Setting stop-loss orders effectively is a practical way to limit risk while giving trades room to develop. For instance, after identifying a bullish engulfing candle, placing a stop-loss just below its low protects capital if the market turns bearish. This technique helps to confidently trade patterns without fear of large downside.
KSE trends influence candlestick effectiveness because market behaviour in Pakistan can shift with liquidity and investor sentiment. For example, during fiscal year-end or after significant policy changes by the State Bank of Pakistan, volatility spikes affect pattern reliability. Awareness of such phases improves timing and interpretation of signals.
Considering regional economic events is equally necessary. Events like Pakistan’s budget announcement, fluctuations in fuel prices due to global crises, or agricultural output reports can cause sharp market reactions. If a bearish pattern appears near such events, it might be better to wait for confirmation, as sudden swings often override technical setups.
In summary, Pakistani traders benefit most when candlestick patterns are not viewed in isolation. Combining them with volume, RSI, overall trends, and local market factors strengthens their practical use. Proper risk management and awareness of Karachi Stock Exchange dynamics make these patterns reliable tools for smarter trading decisions.
📉 Learn to spot bearish candlestick patterns to detect market weakness and smartly time your trades. Practical tips for better trading decisions.

📉 Explore key bearish chart patterns in trading, learn to spot market declines, and manage risk effectively for smarter decisions in Pakistan and beyond.
📈 Master powerful candlestick patterns for stock & Forex trading with our detailed guide. Download a PDF with 35 key patterns to boost your trading skills!
🔍 Explore key candlestick patterns to master price moves. Learn single & multiple formations, tips to read signals, and smart combo with indicators!
Based on 5 reviews