
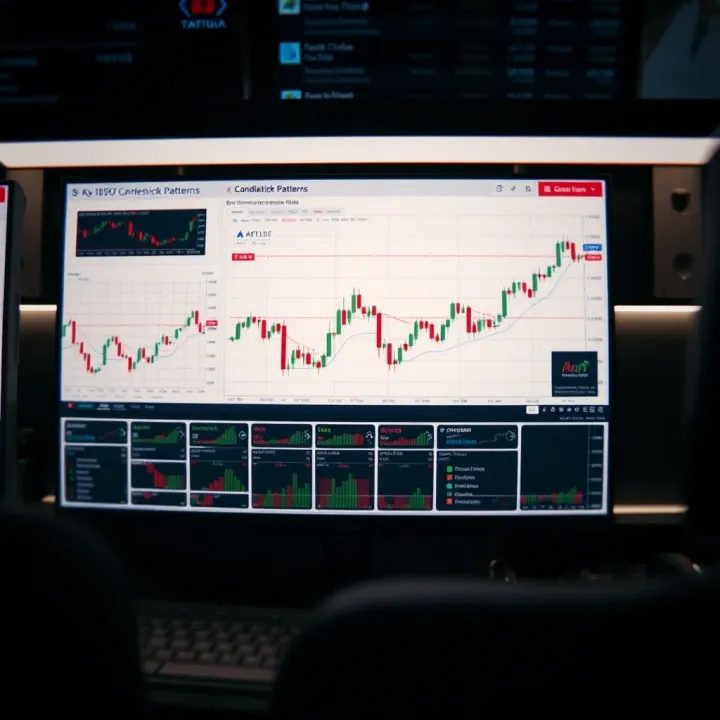
35 Key Candlestick Patterns Explained with PDF Guide
📈 Master 35 key candlestick patterns in trading with our easy guide! Learn to read charts and make smarter trades. Bonus: downloadable PDF included! 📊
Edited By
Henry Davis
Japanese candlestick patterns are a popular method used by traders worldwide to understand price movements in financial markets. These patterns visualise the opening, closing, high, and low prices of an asset within a specific time frame, making it easier to spot trends and possible reversals.
Originating in Japan during the 18th century, this technique was first developed by rice traders to gauge market sentiment. Today, it remains highly relevant for markets including Pakistan’s stock exchange (PSX), forex trading, and even cryptocurrencies like Bitcoin and Ethereum.
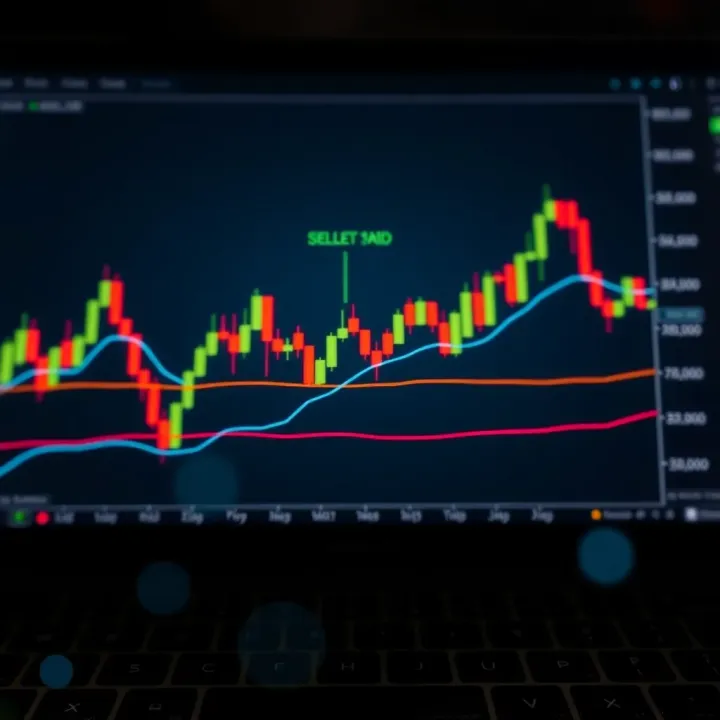
Each candlestick consists of a body and wicks (or shadows). The body shows the price range between the opening and closing, while the wicks represent the highest and lowest prices during the period. A filled (usually red or black) body means the closing price was lower than the opening (bearish), and a hollow (green or white) body means the opposite (bullish).
Understanding these charts helps you identify key patterns such as:
Doji: Signals indecision, where opening and closing prices are nearly the same.
Hammer: Indicates potential bullish reversal after a downtrend.
Engulfing Patterns: Suggests a strong trend change, either bullish or bearish.
Investors in Pakistan can apply these insights by combining candlestick analysis with local market factors, such as corporate earnings reports, SBP (State Bank of Pakistan) policy changes, or geopolitical events affecting the region.
Reading candlestick patterns alone won't guarantee success but integrating them with sound research and risk management can enhance decision-making significantly.
For traders keen to deepen their expertise, many resources including reputable PDF guides are available. These materials provide detailed explanations, examples, and practice charts tailored for Pakistani financial markets.
In summary, Japanese candlestick patterns offer a practical, visual way to interpret market psychology. Familiarising yourself with these can improve your ability to forecast price direction and optimise your investment strategy effectively.
Understanding Japanese candlestick patterns is essential for traders and investors who want to read market sentiment quickly and accurately. These patterns reflect price movements within a specific time frame, giving insights into buyer and seller behaviour. For example, a hammer candlestick in the Pakistan Stock Exchange (PSX) after a downtrend often signals a potential reversal. By mastering these patterns, you can anticipate market shifts before they become obvious through other indicators.
Japanese candlestick charts were developed in the 18th century by Munehisa Homma, a rice trader in Japan. Unlike Western bar charts, candlesticks provide more visual information about trading activity. Homma observed that psychological factors influenced price movements, and he created candlestick patterns to reflect market sentiment. Over time, this method spread to global markets, becoming invaluable for stock, commodity, and cryptocurrency traders alike.
A candlestick consists of three main parts: the body, wick, and shadows. The body shows the opening and closing prices within the chosen time frame, such as one hour or one day. A long body indicates strong buying or selling pressure, while a short body reflects indecision or a weak move. The wick (or shadow) extends above and below the body, showing the highest and lowest prices reached during that period.
For instance, if you look at a one-day candlestick for oil prices on a trading platform like Karachi Electric's fuel commodity segment, a long upper shadow but a short lower shadow with a small body might mean sellers pushed prices down after an initial surge, suggesting resistance at higher levels.
Colours bring candlestick charts to life. Traditionally, a green or white body means the closing price was higher than the opening price, indicating bullish or buying strength. Conversely, a red or black body means the closing price was lower, signalling bearish or selling pressure. In Pakistan's volatile currency market, such colour cues help traders spot momentum fast, especially during times of rupee depreciation.
Understanding these colour signals is more than aesthetics. For example, a series of red candles with long bodies during a forex trading session on the State Bank of Pakistan's trading platform might reflect continuous sell-offs, a hint to reconsider buying.
Mastering the basic parts and colour meaning of candlesticks is your first step to decoding market psychology and making informed trading decisions in Pakistan's dynamic financial markets.
Understanding common Japanese candlestick patterns is essential for traders looking to read market sentiment quickly and accurately. These patterns help identify potential price movements by visually representing buying and selling pressure. Recognising these patterns can be a game changer, especially in Pakistan's fast-moving markets such as KSE and cryptocurrency exchanges where rapid decision-making is key.

A Doji candlestick forms when the opening and closing prices are almost equal, creating a cross or plus sign shape. This pattern signals indecision among buyers and sellers, suggesting that the current market trend might weaken. For example, in a rising market on the PSX, a Doji may hint that bullish momentum is fading, prompting traders to prepare for a possible reversal.
The Hammer and Hanging Man look similar but signal different things depending on their position. A Hammer appearing after a downtrend shows buyers stepping in, often indicating a potential bullish reversal. Conversely, a Hanging Man after an uptrend warns of bearish pressure and possible trend reversal. Traders keep a close eye on volumes during these patterns for confirmation to avoid false signals.
This single candlestick has a small body with a long upper wick, indicating that buyers tried to push prices higher but sellers took control by the close. A Shooting Star near the top of an uptrend suggests that the rally is weakening. In volatile markets like cryptocurrency trading in Pakistan, spotting a Shooting Star might help traders exit before a sharp decline.
The Bullish Engulfing pattern occurs when a small red (bearish) candle is followed by a large green (bullish) candle that fully covers the previous one, signalling strong buying interest. The Bearish Engulfing is the reverse, showing sellers overpowering buyers. On a daily chart of popular Pakistani stocks or forex pairs, these patterns can mark trend changes valuable for entry or exit decisions.
These three-candle patterns provide clearer signals. The Morning Star suggests a bullish reversal and forms after a downtrend with a small candle between a large red one and a big green candle. The Evening Star appears after an uptrend, signalling a bearish reversal. Traders often use these patterns alongside volume and momentum indicators to confirm signals before acting.
The Harami features a large candle followed by a smaller candle completely inside the body of the first one. A Bullish Harami in a downtrend hints that selling pressure may be easing, while a Bearish Harami during an uptrend warns of possible weakness ahead. This pattern helps traders spot potential pauses or reversals, especially when combined with support or resistance levels.
Recognising these candlestick patterns equips traders to anticipate turning points and optimise trade timing. Combining this with local market insights creates a practical edge.
Each pattern shows price psychology in a concise form, making them valuable tools in the arsenal of Pakistani traders and investors navigating stocks, forex, or cryptocurrencies.
Japanese candlestick patterns are a practical tool for understanding market behaviour. They offer a snapshot of trader sentiment during a given period, which helps identify key moments like trend reversals or continuations. For investors and traders in Pakistan’s financial markets, reading these patterns can improve timing decisions for entry and exit points, potentially reducing losses and enhancing profit opportunities.
Recognising reversals and continuations is central to effective market analysis. A reversal indicates a change in trend direction, while a continuation suggests the existing trend will persist. For example, a hammer candlestick appearing after a downtrend often signals a bullish reversal, hinting that buyers are stepping in. Conversely, patterns like the shooting star after an uptrend warn of a bearish reversal.
These patterns alone are not foolproof, but they offer early hints. Imagine a Karachi stock that has been sliding steadily; spotting a bullish engulfing pattern could suggest the share prices may soon climb, encouraging traders to watch or act accordingly. Continuation patterns like rising three methods tell us the current trend, bullish or bearish, is likely to continue, providing confidence in ongoing positions.
Moving averages smooth out price data to reveal trend direction over time, providing a clearer view of market momentum. When combined with candlestick patterns, moving averages help confirm potential shifts. For instance, if a bullish engulfing pattern appears near the 50-day moving average, which acts as support, it strengthens the signal to go long.
Additionally, crossovers between short and long-term moving averages — like the 20-day crossing above the 50-day — alongside candlestick signals can mark strong entry points. This approach prevents relying solely on candlesticks, lowering the risk of false signals amid market noise.
The Relative Strength Index (RSI) measures overbought or oversold conditions by comparing recent gains and losses. Pairing RSI with candlestick patterns can sharpen timing decisions. For example, a doji appearing when RSI is under 30 (oversold) suggests a potential bullish reversal. Traders in Pakistan can use this to spot shares ready for a bounce after heavy falls.
The Moving Average Convergence Divergence (MACD) indicator tracks momentum and trend changes via two moving averages. When a candlestick reversal pattern aligns with a MACD crossover, such as the MACD line crossing above the signal line, it signals a stronger buy opportunity. By combining these tools, investors gain a more reliable picture of both price action and underlying market strength.
Using candlestick patterns alongside indicators like moving averages, RSI, and MACD provides a balanced toolkit. This not only helps to identify trends more accurately but also minimizes chances of false trade signals, particularly in the volatile Pakistani market.
In short, candlestick patterns are not standalone solutions but are most effective when blended with other analytical tools to make informed trading decisions.
Understanding how to read and interpret Japanese candlestick charts is key for anyone seriously involved in trading or investing. These charts pack a lot of information about market sentiment, price action, and potential turning points in a compact visual form. For Pakistani traders dealing with volatile assets like equities or cryptocurrencies, mastering candlestick charts can sharpen decision-making and help manage risks effectively.
At the core, each candlestick shows the open, close, high, and low prices within a specific time frame — whether it’s 5 minutes, 1 hour, or a day. Getting comfortable with what these shapes and colours mean can give you a quick, insightful snapshot of market behaviour. For instance, a long green candlestick indicates strong buying pressure, while a doji—a candle with nearly equal open and close—tells you that buyers and sellers are at a standstill, suggesting indecision.
To start using candlestick charts, pick a reliable charting platform that supports Pakistani market data or whichever market you trade in. Platforms like TradingView or MetaTrader are popular among Pakistani traders for providing live candlestick charts with customizable time frames.
Set your chart to the desired interval fitting your trading style—day traders might prefer 5-minute or 15-minute candlesticks, while medium to long-term investors usually opt for daily or weekly candles. Always ensure the chart shows volume alongside price, as volume adds context to price movements, confirming the strength or weakness of a pattern.
Also, adjust the chart’s colour scheme if needed; traditionally, green (or white) signifies a price rise and red (or black) a fall, but choose what’s visually clearer for you. Finally, add basic technical indicators like moving averages or RSI to complement candlestick readings and avoid relying on one type of data alone.
A frequent pitfall is reading candlestick patterns in isolation. Relying solely on one candle or pattern without considering the overall trend or volume can lead to false signals. For example, spotting a hammer candle during a downtrend might suggest reversal, but if volume is low or other indicators don’t support it, the pattern might not hold.
Another mistake is ignoring different time frames. A bullish engulfing pattern on an hourly chart might conflict with a clear downtrend on the daily chart. Always cross-check signals on multiple time frames to get a more reliable reading.
Lastly, traders often fall into the trap of forcing interpretations—seeing patterns that fit a bias rather than what the data objectively shows. Be patient, confirm patterns, and always use stop-loss orders to protect yourself.
Properly reading candlestick charts requires understanding their place within the broader market context, not just memorising patterns. Combine chart analysis with sound risk management and your trading toolkit will be much stronger.
Using PDFs focused on Japanese candlestick patterns can greatly improve your chart-reading skills and trading decisions. These documents typically provide concise explanations, detailed illustrations, and real-market examples that help clarify complex concepts. For Pakistnai traders and investors navigating the KSE-100 or even cryptocurrency markets, having quick access to reliable PDFs means you can study patterns anywhere, even offline.
PDFs often compile key information in a structured way, making revision easier when you’re preparing for trading sessions or analysing past trades. Unlike scattered web articles or lengthy books, a well-organised PDF can pinpoint what matters most—pattern shapes, implications, and typical market scenarios—saving you time.
Several websites and platforms offer downloadable PDF guides on candlestick patterns tailored to beginners and advanced traders alike. Look for sources that provide:
Clear visuals of patterns like doji, engulfing, hammer, and harami
Practical tips on spotting these patterns in Pakistani stocks, forex, or crypto charts
Case studies showing how patterns predicted real trend reversals or continuations
For example, platforms like Investopedia, Babypips, or local financial training firms often publish free or low-cost PDFs that suit Pakistani market conditions. You might also find eBooks from experienced traders who explain chart setups common on PSX or in WMP trading. Always verify the publication date and author credibility to avoid outdated or misleading information.
Simply downloading PDFs is not enough; regular and focused study is critical. Break down your learning sessions into manageable chunks—start with single candlestick patterns before moving to multi-candle formations. Use both historical and live charts from platforms like PSX or crypto exchanges to test your knowledge.
Try to annotate PDFs with notes, highlighting patterns you find confusing or especially useful. Practicing pattern recognition on real charts every day helps cement your understanding and sharpens your instincts.
Remember, candlestick patterns should be used in conjunction with other tools like moving averages or RSI for better accuracy. PDFs can guide you on how to combine these techniques effectively.
Finally, join trading communities or forums where members share PDFs and discuss their experiences. This interactive learning often provides practical insights that textbooks or static documents miss. Consistency is key—daily review of patterns from PDFs alongside actual market data will gradually make you confident in spotting profitable setups.
Accessing good Japanese candlestick pattern PDFs offers Pakistani traders a convenient way to master this essential aspect of technical analysis. When combined with hands-on chart practice and other indicators, these resources become powerful tools to improve your market timing and trading success.
📈 Master 35 key candlestick patterns in trading with our easy guide! Learn to read charts and make smarter trades. Bonus: downloadable PDF included! 📊

📊 Learn key chart patterns in technical analysis to improve your trading skills. Explore major types and access reliable Pakistani resources like books and PDFs.
📉 Learn to spot bearish candlestick patterns to detect market weakness and smartly time your trades. Practical tips for better trading decisions.
🔍 Explore key candlestick patterns to master price moves. Learn single & multiple formations, tips to read signals, and smart combo with indicators!
Based on 6 reviews