
Master Key Candlestick Patterns for Trading Success
📈 Master powerful candlestick patterns for stock & Forex trading with our detailed guide. Download a PDF with 35 key patterns to boost your trading skills!
Edited By
Oliver Hughes
Reversal candlestick patterns give traders early clues that a market trend might be shifting direction. Recognising these signals can help you avoid losses and capture profits by entering or exiting positions at just the right time.
These patterns form on price charts when the forces of buyers and sellers change balance, usually after a sustained move up or down. Identifying them involves reading the shape and position of the candlestick relative to previous bars, which reflects market sentiment.
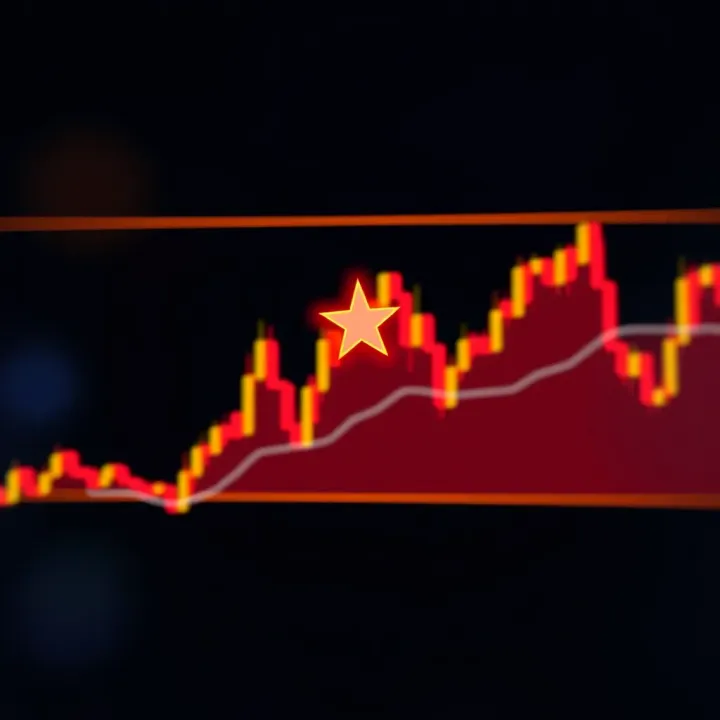
Common reversal patterns include the hammer, shooting star, engulfing patterns, and the doji. For example, a hammer appears after a downtrend and has a small body with a long lower wick, showing that sellers pushed prices down but buyers regained control before the close. This signals a potential bullish reversal.
On the flip side, a shooting star forms after an uptrend with a small body and a long upper wick, indicating sellers forced prices down before closing near the opening level. It warns of a possible bearish reversal.
Keep in mind, no pattern works perfectly alone. Confirmation from volume, subsequent price action, or other technical indicators improves accuracy.
Here are key points to note:
Bullish reversal patterns suggest a drop in selling pressure, often after a downtrend, providing an opportunity to go long.
Bearish reversal patterns signal weakening buying interest following an uptrend, alerting traders to potential pullbacks or short-selling chances.
Always consider the context: patterns at strong support or resistance levels carry more weight.
Combine pattern recognition with risk management and trade confirmation techniques.
In Pakistan’s volatile markets, including PSX stocks or cryptocurrency platforms like Binance and local brokers, mastering reversal patterns can refine your strategy. For instance, spotting a hammer during a market dip could help you buy before the bounce, while recognising a shooting star near an all-time high may warn against chasing prices.
Understanding these reversal candlestick patterns is a skill that grows with practice. Watching how markets react to these signals over time will improve your timing and overall trading results.
Reversal candlestick patterns hold a key role in trading, especially when spotting potential shifts in market trends. These patterns help traders identify moments when the market might turn direction, either from bullish to bearish or vice versa. For example, spotting a hammer pattern after a downtrend on the Pakistan Stock Exchange (PSX) can signal the start of a price rise, giving traders a chance to enter before the market picks up.
Understanding reversal patterns also sharpens decision-making in volatile markets like Forex, where currencies like PKR see frequent swings. By recognising these patterns, traders can better time entries and exits, reducing the risk of losses in unpredictable conditions.
A candlestick shows price action in a specific time period, like one hour or a day. It consists of a body and wicks (shadows). The body represents the opening and closing prices, while the wicks show the highest and lowest prices during that period. This simple visual encodes a lot of information quickly—traders can see where price moved, whether buyers or sellers controlled the session, and how strong the move was.
In practical terms, think of a daily chart for a PSX stock. A candlestick that opens at Rs 100 and closes at Rs 110 with a long upper wick tells you that price faced resistance near the high but buyers still pushed it up overall.
The body’s length shows the strength of buying or selling pressure. A long green (or white) body means buyers dominated, closing much higher than the open. Conversely, a long red (or black) body means sellers controlled the session. Wicks on either side reveal price volatility—long lower wick with a short body often suggests rejection of lower prices, a bullish sign.
For example, a hammer features a small body near the top and a long lower wick, indicating sellers pushed prices down, but buyers regained control, hinting at a possible reversal.
Reversal patterns mark areas where momentum is shifting. A bullish reversal pattern, like a Morning Star, might appear after a downtrend and signals buyers stepping in strong enough to challenge sellers. This suggests the downtrend could end, and prices may start rising.
Such signals are critical, especially when combined with volume spikes or confirmation from other indicators, as they provide a higher chance that the trend is really changing, not just pausing briefly.
While reversal patterns hint at a change in trend, continuation patterns suggest the current trend will persist. For example, a Doji during a strong uptrend might be a sign of indecision but does not necessarily mean the trend will flip.
Identifying whether a pattern signals a pause or a reversal helps traders avoid false alarms. In the context of Pakistani markets, knowing this distinction can prevent unnecessary losses during volatile political or economic announcements that cause short-term price swings.
Understanding candlestick patterns themselves is just the start; recognising which patterns signal a real reversal—and which don’t—is vital for timing your trades effectively and staying ahead in the market.

Bullish reversal candlestick patterns play a vital role in trading by signalling a potential shift from downtrend to uptrend. Recognising these patterns helps traders enter or add to long positions before prices begin to rise. Pakistani investors following stocks on the Pakistan Stock Exchange (PSX) or forex traders dealing in PKR pairs can benefit from spotting these early signals. Each pattern carries specific visual cues and psychological implications that reflect the changing sentiment among market participants.
A hammer candlestick has a small body near the top and a long lower wick, usually at least twice the length of the body. The colour of the body can be bullish (green/white) or bearish (red/black), but its shape matters most. An inverted hammer looks like the opposite: a small body at the bottom with a long upper wick. Both patterns appear after a downtrend, suggesting possible market bottoming.
These patterns show that sellers tried to push prices lower during the session but buyers returned strongly, especially at the close in a hammer’s case. It implies diminishing selling pressure and growing buying interest. For instance, a PSX stock that formed a hammer after several days of decline implies buyers are gaining confidence. The inverted hammer signals early buying interest too, though confirmation with the next candle is crucial since the long wick shows resistance at higher levels.
The morning star consists of three candles: a long bearish candle, a small-bodied candle (could be bullish or bearish) that gaps down or forms a notable gap below the first candle, followed by a long bullish candle that closes above the midpoint of the first. This sequence suggests that selling momentum has weakened and buyers command the market again.
The first candle confirms continued selling. The second reflects indecision or a pause—buyers and sellers are almost balanced. The third candle marks the comeback of buyers who push prices higher, signalling a bullish reversal. In Pakistani markets, this pattern on high-volume days can be especially meaningful, often followed by good price runs.
A bullish engulfing pattern occurs when a small bearish candle is immediately followed by a larger bullish candle that completely covers or "engulfs" the previous body. This suggests a sudden surge of buying power overtaking sellers. Traders spot this pattern at the end of downtrends or near key support levels as an early buy signal.
A bullish engulfing pattern indicates strong demand pushing prices upward. For instance, if a forex pair like USD/PKR forms this pattern on a daily chart, it could precede a trend reversal or a rally. Confirmation with volume or momentum indicators strengthens the signal’s reliability, encouraging traders to consider a long position while managing risk with stop-loss orders below the pattern’s low.
Recognising these common bullish reversal patterns allows traders to anticipate price shifts more confidently. However, combining pattern recognition with volume and other technical indicators increases success in dynamic markets like PSX and forex trading in Pakistan.
Recognising common bearish reversal candlestick patterns helps traders identify potential price drops early. These patterns often mark the end of an upward rally and signal sellers gaining control. For example, the Shooting Star, Evening Star, and Bearish Engulfing patterns provide distinct visual cues showing weakening bullish momentum. Pakistani traders can use these signals to time exits or short entries, especially in volatile markets like the Pakistan Stock Exchange (PSX) or Forex trading involving PKR.
Visual traits: The Shooting Star has a small body near the day's low and a long upper wick, usually twice the body size. This shape indicates sellers pushed the price up temporarily but buyers failed to hold gains. It often appears after a strong uptrend, making it easy to spot on candlestick charts.
Why it suggests a downward reversal: The long upper wick reveals that the market rejected higher prices, as selling pressure overwhelmed buyers near the peak. This shift commonly results in lower prices over the following sessions. For instance, a PSX stock showing a Shooting Star after consistent gains may face profit-taking, leading to a price drop.
Three-candle pattern explained: The Evening Star unfolds over three candles. First, a large bullish candle shows strong buying. Next, a small candle with a short body indicates indecision or weakening momentum. Finally, a large bearish candle closes below the midpoint of the first candle, confirming sellers taking control.
This formation points to a transition from bullish to bearish sentiment. Pakistani traders often spot this pattern when a popular stock or commodity rallies too quickly and starts losing steam.
Significance in market trends: The Evening Star signals that an uptrend may end soon. Its clear structure helps traders avoid false alarms. Using volume confirmation strengthens the signal’s reliability, as rising volume on the third bearish candle confirms selling interest.
Pattern details: This pattern appears when a small bullish candle is followed by a large bearish candle that completely engulfs it. The bigger body shows sellers have overwhelmed buyers, marking potential trend reversal. It usually forms after a price rise and is straightforward to spot on charts.
How to spot bearish pressure: The engulfing candle must close below the previous candle’s open, signalling strong selling. This shift in control often leads to further declines. For example, if a PSX stock forms this pattern near resistance levels, it may indicate an ideal moment to sell or short.
Bearish reversal patterns like these offer timely warnings. Combining them with volume and other indicators helps Pakistani traders manage risk and improve trade timing, avoiding trading against the market’s momentum.
Reversal candlestick patterns offer valuable signals for traders aiming to anticipate changes in market direction. However, recognising these patterns alone is not enough. Applying them effectively requires combining pattern analysis with other tools and strategies to improve the chances of success and manage risk.
Volume acts as a key confirmation tool when spotting reversal candlestick patterns. A pattern accompanied by high trading volume suggests stronger conviction behind the move. For example, after spotting a bullish engulfing pattern in a PSX stock, if the volume surges significantly, it indicates that buyers are stepping in assertively, making the reversal signal more reliable. Conversely, low volume may hint at a weak or false signal, urging caution.
Technical indicators like the Relative Strength Index (RSI) and Moving Average Convergence Divergence (MACD) provide further context. RSI helps identify overbought or oversold market conditions, aligning with reversal signals. Suppose a shooting star appears while RSI reads above 70, indicating overbought levels; this supports the bearish reversal suggestion. MACD crossovers around reversal patterns also strengthen confidence by confirming momentum shifts. Combining these tools helps traders avoid relying solely on price action.
Proper placement of stop-loss orders is essential to protect capital from unexpected market swings after entering a trade based on reversal patterns. A common strategy is to place the stop-loss just beyond the pattern’s extreme wick. For example, after a hammer pattern signals a potential bullish flip in a Forex pair involving PKR, setting the stop-loss slightly below the hammer’s low minimises losses if the price reverses contrary to expectations.
Timing entries requires waiting for pattern completion and sometimes the next candle’s confirmation. Jumping in too early can lead to false signals. After a morning star pattern forms on a PSX stock chart, many traders wait for the fourth candle to close above the star before entering long positions. This reduces risks and improves trade accuracy.
A key challenge with reversal patterns is differentiating genuine signals from noise. Common pitfalls include mistaking minor pullbacks for full reversals or trading patterns without volume support. Also, relying on reversal signals during choppy or sideways markets often leads to losses since the context isn’t favourable.
Market conditions and timeframes affect the effectiveness of reversal patterns. On shorter timeframes like 5-minute charts, reversal patterns may appear more frequently but can be less reliable due to market noise. Meanwhile, daily charts usually offer stronger, more dependable signals. Traders should match their trading style and timeframe with the reliability of the reversal patterns accordingly.
Successful trading with reversal candlesticks hinges on confirmation, disciplined entry and exit plans, and awareness of broader market behaviour to reduce false alarms and enhance profitability.
Pakistani traders face unique challenges and opportunities when applying reversal candlestick patterns. Understanding local market behaviour, economic conditions, and geopolitical developments can enhance your trading decisions. Practical tips tailored to PSX (Pakistan Stock Exchange) and Forex markets help bridge theory and real-world execution.
Trading PSX stocks often involves sectors sensitive to local economic trends, like banking, textiles, and energy. For example, the bullish engulfing pattern in a blue-chip stock like Habib Bank Limited (HBL) may hint at a possible upward turnaround, especially after a period of consolidation. Watching volume spikes alongside these candlestick signals offers more confidence before entering trades.
Similarly, the bearish engulfing pattern appearing on Lucky Cement's chart can signal selling pressure tied to sector-specific issues or broader market concerns. Recognising these patterns on daily or weekly charts helps traders time entries and exits effectively.
Forex trading in PKR demands close attention to reversal patterns because the Pakistani Rupee often reacts sharply to political announcements or foreign exchange reserves updates. A shooting star candlestick on the USD/PKR chart after a rally, for example, could forecast a correction. Yet, confirming with RSI or MACD indicators plus monitoring central bank interventions is crucial.
Traders should also factor in volatility spikes during major events like SBP policy announcements. Using reversal patterns alongside technical indicators can guide better risk management in the Forex market.
Pakistani markets are sensitive to political developments such as budget announcements, election results, or foreign policy shifts. These events can trigger strong market moves that either confirm or negate reversal patterns. For instance, a hammer candlestick right after a positive economic report may mark a genuine bullish reversal.
Conversely, reversal signals appearing during political uncertainty might not sustain, so cross-checking with news flow and economic indicators is vital. Staying updated on FBR tax policies or inflation numbers helps anticipate market behaviour.
Market activity tends to slow during Ramadan, affecting liquidity and sometimes causing erratic price moves. Traders should interpret reversal patterns cautiously in this period, as thinner volume may produce false signals.
Similarly, during national holidays or Eid festive seasons, price gaps and sudden swings are common. Adjusting stop-loss levels and avoiding overtrading before or after such holidays can save losses. Recognising these seasonal effects helps Pakistani traders align their strategies with market rhythms.
Keeping local nuances in mind enriches your technical analysis and improves trade precision in Pakistan’s unique trading environment.
📈 Master powerful candlestick patterns for stock & Forex trading with our detailed guide. Download a PDF with 35 key patterns to boost your trading skills!

📉 Learn to spot bearish candlestick patterns to detect market weakness and smartly time your trades. Practical tips for better trading decisions.

📈 Learn how bullish and bearish candlestick patterns guide traders in Pakistan to read market trends, make smarter moves, and improve investment results.

📊 Learn key chart patterns to predict market trends and improve trading in Pakistan. Find detailed explanations and PDF resources for practical use and strategy.
Based on 10 reviews