

Understanding Chart Patterns for Traders in Pakistan
📊 Learn key chart patterns in technical analysis to improve your trading skills. Explore major types and access reliable Pakistani resources like books and PDFs.
Edited By
Sophie Langley
Trade chart patterns serve as visual cues that help traders spot market trends and potential price moves early. These patterns reveal shifts in supply and demand, enabling better timing for entries and exits. For traders and investors in Pakistan, understanding these patterns can improve decision-making in stocks, forex, and cryptocurrency markets.
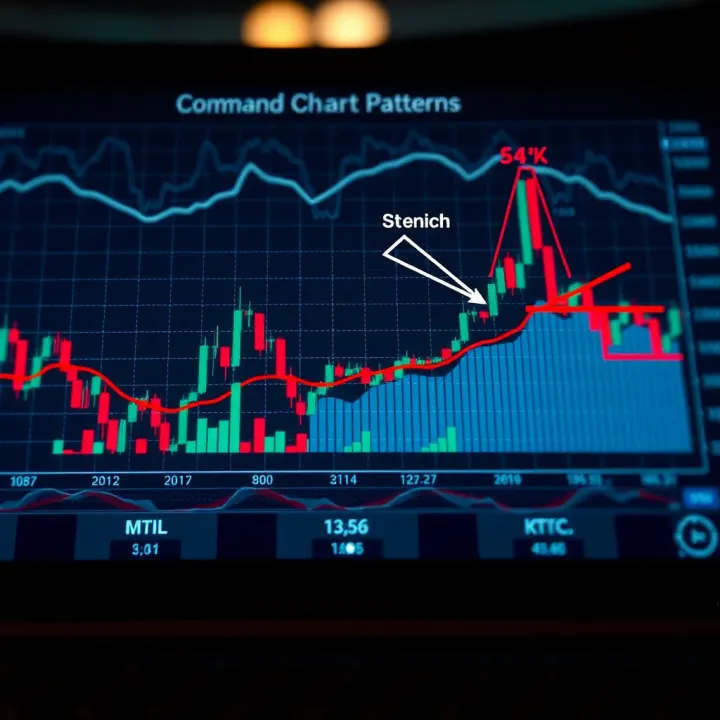
Fundamentally, chart patterns fall into two categories: continuation patterns, which suggest a trend will persist, and reversal patterns, signaling a possible change in direction. Examples include the head and shoulders pattern for potential trend reversals, and flags or pennants indicating short pauses before the trend resumes.

Using PDF resources dedicated to these patterns can be especially helpful. PDFs offer a portable, easy-to-reference format packed with charts, definitions, and trading tips ideal for quick study or offline review. For instance, well-structured PDFs from educational platforms or brokerage firms can guide you through the nuances of pattern recognition and common pitfalls.
Here are some quick tips for using chart patterns effectively:
Confirm patterns with volume trends; rising volume often validates the pattern.
Combine patterns with technical indicators like RSI or moving averages.
Avoid jumping into trades solely based on a single pattern; look for confluence.
Clear chart pattern identification isn’t just about spotting shapes. It involves understanding market psychology, interpreting price action, and managing risk accordingly.
Mastering chart reading takes practice but improves your ability to anticipate market behaviour. Traders who regularly review PDF guides while applying real-time chart analysis tend to gain more confidence and accuracy over time. In the following sections, we will explore key patterns in detail, discuss common mistakes, and provide practical advice on sharpening your chart reading skills for better trading outcomes.
Trade chart patterns form the foundation of technical analysis, helping traders decode market behaviour through visual clues. Understanding these basics equips traders to read price charts effectively, spot potential market moves, and make informed decisions. For example, recognising a 'head and shoulders' pattern early can save you from a costly mistake in volatile Pakistani equities or the forex market.
Chart patterns are specific formations on price charts that repeat over time and reflect the psychology of market participants. These patterns help traders interpret bullish or bearish sentiment and anticipate future price action. Their practical use lies in providing a road map, allowing traders to gauge when to enter or exit a trade.
Patterns appear as shapes or formations on candlestick or line charts, such as triangles, flags, or double tops. For instance, the ascending triangle shows a consolidation with rising lows, signalling potential upward breakout. Seeing these on your trading platform helps you quickly assess market direction without wading through complex data.
Chart patterns act like signposts for trends. By recognising continuation patterns like flags or reversal patterns such as double bottoms, traders can confirm if the current trend will persist or reverse. This skill is valuable in markets like Pakistan Stock Exchange (PSX), where trend volatility is common.
Patterns not only show current trends but suggest price targets and potential reversals. For example, a breakout from a pennant pattern often signals a strong price surge in the same direction. Using patterns alongside volume increases and other signals improves prediction accuracy, especially in fast-moving markets like Bitcoin trading.
PDF guides allow traders to study chart patterns anytime, even without internet access—a practical feature during power outages in some areas. Portability means you can refer back to examples, diagrams, and strategies on your mobile or tablet during live trading sessions or teaching moments.
Not all PDF materials carry the same quality. Opt for resources from established brokerage educational portals or reputed market analysis websites that focus on Pakistani markets. Reliable PDFs include clear illustrations, updated information, and practical trading tips rather than generic or outdated content.
Understanding these basics offers a strong starting point, making your trading both smarter and more confident. Take time to practice recognising patterns on local market charts and combine them with trusted PDF resources for ongoing learning.
Understanding the main categories of chart patterns is essential for any trader aiming to read price action effectively. These patterns help reveal whether a price is likely to continue its current trend, reverse, or could move in either direction. In practice, recognising these categories allows traders to plan entries, exits, and manage risk with more confidence.
Flags and Pennants are short-term continuation patterns that signal a pause before the trend resumes. Flags appear as small rectangular shapes slanting opposite the prevailing trend, while pennants resemble tiny symmetrical triangles. For instance, if a stock in an uptrend forms a flag, it usually indicates brief consolidation before prices surge higher. Traders often watch for breakouts above the flag or pennant to time their entries.
Triangles (Symmetrical, Ascending, Descending) point to indecision in the market, where buyers and sellers balance out. A symmetrical triangle, with contracting trendlines, suggests the price could break out either way, but usually in line with the prior trend. Ascending triangles show rising lows meeting a resistance level, favouring bullish breakouts. Descending triangles, with falling highs and a steady support line, typically lead to bearish moves. These patterns help traders anticipate strong moves after consolidation.

The Head and Shoulders pattern is a reliable reversal sign, commonly marking the end of an uptrend. It features three peaks, with the middle (head) higher than the shoulders on either side. A break below the “neckline” connecting the two troughs confirms the reversal. For example, in the PSX (Pakistan Stock Exchange), a head and shoulders pattern might signal an upcoming downtrend, prompting traders to exit or short sell.
Double Tops and Bottoms show two failed attempts to break resistance or support. A double top forms when the price hits a high twice but fails to go higher, signalling likely downward movement after support breaks. Conversely, a double bottom indicates a potential uptrend after price tests support twice. These patterns are practical for setting stop-loss orders just beyond these levels.
Triple Tops and Bottoms are similar but involve three peaks or troughs at nearly the same price level. This pattern strengthens the reversal signal, as repeated tests confirm resistance or support stubbornness. Traders find triple formations reliable for anticipating substantial trend changes, often adjusting their trading strategies accordingly.
Rectangles form when price bounces between parallel support and resistance lines, showing indecision. They are bilateral because the breakout can occur either way. For a trader in Karachi or Lahore, spotting a rectangle helps in preparing for a breakout move, which can be sharper due to accumulated buying or selling pressure.
Wedges incline diagonally and signify slowing momentum. Falling wedges usually point to bullish reversals, while rising wedges hint at bearish shifts. These patterns differ from triangles by their slanted parallel trendlines. Wedges are especially useful for timing entries when combined with volume analysis, which confirms the pattern’s strength.
Spotting these main chart pattern categories and understanding their behaviour improves trade decision-making. They offer a blend of signals that reflects market sentiment, helping traders in Pakistan and beyond navigate volatility consistently.
Chart patterns give you visual cues about market behaviour, helping to make better trading decisions. Knowing how to identify and trade these patterns improves your chance of entering and exiting trades at the right moments. Traders and analysts in Pakistan often use these patterns on KSE-listed stocks, forex, or even cryptocurrencies to read market sentiment.
Trendlines connect significant highs or lows on a price chart, indicating the direction of the current movement—uptrend, downtrend, or sideways. Support and resistance levels mark price points where buying or selling pressure pauses or reverses the trend. For instance, on the PSX, a stock might repeatedly bounce back after hitting Rs 300, showing strong support. Spotting these levels helps decide if a pattern signals continuation or reversal.
Volume measures the number of shares or contracts traded, reflecting market participation. Confirmation by volume is key when trading chart patterns. For example, a breakout from a triangle pattern with rising volume suggests strong conviction, making the move more credible. If volume is low during a breakout, the price might quickly fall back, leading to a false signal.
Breakouts occur when price moves past critical support or resistance, signalling a potential new trend phase. Traders often enter after confirming a breakout with volume, aiming to ride the momentum. Pullbacks are temporary pauses or reverses after a breakout, offering better entry points at a lower risk. In the Karachi market, waiting for a pullback can help avoid entering too early when volatility spikes.
Protecting capital is essential. Stop loss orders limit losses by exiting trades when price moves unfavourably, commonly set just below support or above resistance levels. Take profit targets allow locking in gains, often calculated by measuring the pattern’s height projected from breakout points. For example, if the head and shoulders pattern suggests a 10% drop, setting take profit accordingly avoids greed-induced mistakes.
New traders often confuse similar-looking patterns or mistake random price movements for valid patterns. For example, head and shoulders requires clear shoulders and a neckline – a sloppy formation should not be traded on. Misreading can lead to entering trades with no real edge, increasing risks unnecessarily.
Chart patterns alone don’t guarantee success. Relying solely on them without checking volume, broader market trend, or fundamental factors often results in losses. Pakistani traders, especially those following volatile sectors like tech stocks or FX, must confirm patterns using indicators like RSI or MACD alongside price action.
Mastering chart patterns takes patience and practice. Always combine visual signals with volume and risk controls to improve your trading results effectively.
Accessing high-quality PDFs on trade chart patterns is an efficient way to study technical analysis at your own pace. These PDFs provide detailed illustrations, definitions, and examples that help traders build a solid foundation without having to rely on internet connectivity all the time. Using these portable resources on a mobile, laptop, or tablet makes it easy to revisit concepts before making trading decisions.
Brokerage Educational Portals often offer trustworthy, well-structured PDF guides. Brokers like HBL Securities, MCB Arif Habib Savings & Investments, and AKD Securities provide educational material designed to help traders understand chart patterns specific to local and international markets. These PDFs frequently include market scenarios tailored to PSX, making the content relevant for Pakistani traders. Besides technical knowledge, these portals sometimes bundle in updates about trends affecting local stocks, giving you a comprehensive learning experience.
Market Analysis Websites also serve as a valuable resource. Trusted platforms such as Investing.com Pakistan and ProPakistani Business section publish downloadable PDFs that explain popular patterns along with strategy recommendations. Such websites usually update their content regularly to match current market conditions. For example, during volatile periods in the rupee-dollar exchange, these PDFs might highlight trade setups that factor in external economic shifts, which helps readers adapt strategies as per current environments.
When studying PDFs, highlighting and note-making significantly improve retention. Mark key pattern characteristics, entry and exit signals, and volume clues directly on your second screen or printed copy. This active engagement prevents passive reading and turns static pages into interactive study sessions. For instance, underline sections discussing false breakouts—a common pitfall so you don’t repeat mistakes.
Practice with real market charts alongside PDF study to cement your understanding. Opening trading platforms such as PSX’s web portal or local brokerage chart tools allows you to compare live data with patterns explained in PDFs. Spotting a triangle pattern or a head-and-shoulders formation on current stock charts sharpens both recognition and timing skills. This hands-on method gives immediate feedback, making the theoretical knowledge practical.
Effective version control ensures you do not fall behind with outdated information. Chart patterns evolve slightly with new market behaviour and regulatory changes. If you download a PDF on technical analysis from 2015, it might miss latest trading rules implemented by SECP or new broker tools. Always check the publication date and source before using a PDF for decision-making.
Good digital file management helps keep your study material accessible. Create organised folders by topic or source on your device and back them up regularly. Naming files clearly with publication date and focus area (e.g., "Triangle_Patterns_MCB_2024.pdf") makes retrieval easier during quick reviews. This small effort saves valuable time during active trading sessions, especially when Pakistani markets can shift quickly due to political or economic news.
Using well-selected PDF guides combined with disciplined study habits and real chart practice builds confidence. This approach helps traders in Pakistan and beyond master chart patterns and make informed trading choices effectively.
Understanding technical patterns alone won't guarantee success in trading. Practical tips help traders apply these patterns effectively alongside other tools and strategies, increasing the chance of consistent profits. This section explores how combining chart patterns with different analysis methods, developing a clear trading plan, and committing to continuous learning can give you an edge in Pakistan's dynamic markets.
Technical indicators like moving averages, Relative Strength Index (RSI), and Moving Average Convergence Divergence (MACD) complement chart patterns by confirming trend strength or momentum. For instance, when a bullish flag pattern forms on a stock trading at the PSX, an RSI above 50 adds confidence that upward momentum will continue. Without such confirmation, the pattern may produce false signals.
Oscillators help identify overbought or oversold conditions. If a double top pattern appears alongside an RSI showing overbought levels, it suggests a higher chance of reversal. By combining these signals, traders reduce reliance on chart patterns alone, making smarter entry and exit decisions.
While chart patterns focus on price action, fundamental analysis considers the broader economic picture—company earnings, interest rates, or geopolitical events affecting price movements. For example, a head and shoulders pattern forming in a major Pakistani bank's shares may signal a trend reversal, but if the bank just announced strong quarterly results, the pattern might fail.
Integrating fundamental factors prevents blindly following patterns. Keeping an eye on Pakistan's State Bank policy changes or corporate announcements alongside chart readings helps traders avoid getting caught in misleading setups.
No pattern works every time, so managing risk is vital. Decide your maximum loss per trade before entering the market—often 1-2% of your capital. Using stop loss orders below key support or above resistance lines identified in patterns limits downside. For example, after spotting a triangle breakout on a KSE stock, place a stop loss just below the breakout point.
Proper risk control keeps your account safe through losing streaks. Without this discipline, even the most promising chart patterns can cause big losses.
Testing patterns on historical data reveals how well they perform under different conditions. For instance, try applying a double bottom pattern to various 1-year charts from PSX or cryptocurrency markets in Pakistan. Track which patterns yield profitable entries and their average success rates.
Backtesting helps refine your approach, showing which patterns suit your trading style and which need extra confirmation before taking trades. Digital platforms or spreadsheet tools simplify keeping records.
Regularly evaluate your trades to identify strengths and mistakes. Did the chart pattern work as expected? Were your stop losses placed correctly? What happened if you ignored confirmation indicators? Reflecting on past decisions sharpens your understanding and improves judgement.
Keeping a trading journal with screenshots and notes supports this habit.
Markets evolve, influenced by regulatory changes, economic data, or global events. Staying tuned to Pakistan's business news, SBP announcements, or political developments helps you anticipate volatility that could invalidate certain patterns.
Updates like changes in oil prices or load shedding schedules may also affect sector-specific stocks, impacting chart reliability. Adapting your trading approach with current market realities ensures patterns remain practical tools rather than out-of-date guesses.
Combining chart patterns with complementary tools, a clear risk-conscious plan, and ongoing learning turns theoretical knowledge into trading skill. This approach suits traders and investors aiming for consistent results in Pakistan's financial markets.
📊 Learn key chart patterns in technical analysis to improve your trading skills. Explore major types and access reliable Pakistani resources like books and PDFs.

📊 Learn key chart patterns to predict market trends and improve trading in Pakistan. Find detailed explanations and PDF resources for practical use and strategy.

Learn to spot 7 key chart patterns in trading 📈. Understand their traits, signals, and impacts with a handy PDF guide perfect for every trader in Pakistan.
📊 Learn key chart patterns from expert books to spot market trends and price moves. Essential tips tailored for Pakistani traders aiming for smarter investments 🚀
Based on 6 reviews