
Effective Forex Trading Strategies for Pakistani Traders
Learn effective forex trading strategies tailored for Pakistani traders 🇵🇰. Master market analysis, risk management, and practical tips to trade smartly.
Edited By
Charlotte Phillips
Forex trading graphs serve as a vital window into the shifting dynamics of currency markets. For Pakistani traders, understanding how to interpret these graphs can directly impact trading success and risk management.
At its core, a forex graph plots the value of one currency against another over time. This visual representation helps traders identify trends, spot turning points, and assess market sentiment at a glance. In Pakistan, where rupee exchange rates with the US dollar, euro, and regional currencies like the Chinese yuan influence many businesses and individuals, reading these graphs accurately is essential.
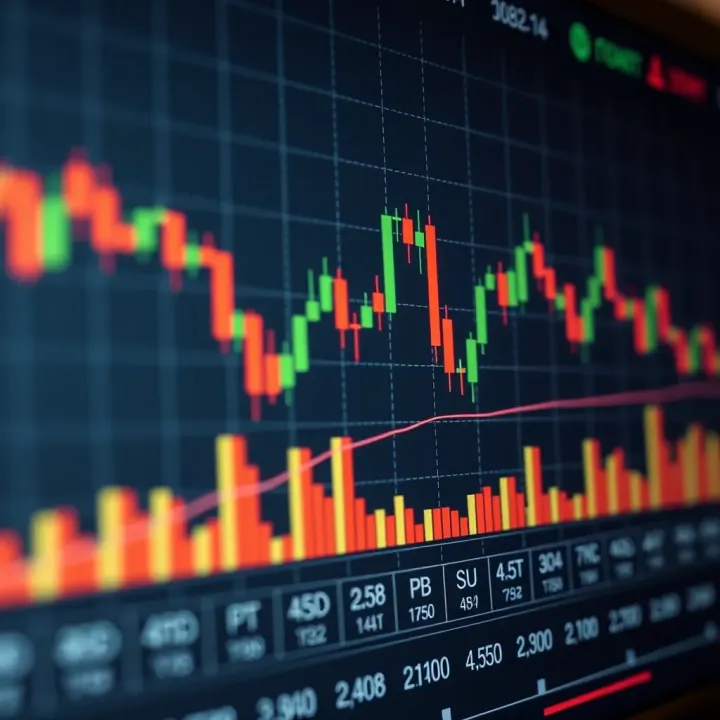
Graphs come in several popular formats:
Line charts: Simple and clear, they show closing prices over chosen intervals. These suit beginners who want to track general price movement.
Bar charts: More detailed, they display open, high, low, and close (OHLC) information for each period.
Candlestick charts: Widely used by professional traders, these reveal price action and momentum through distinctive coloured bars.
Each type provides different layers of insight. Among the key tools to analyse them are technical indicators such as Moving Averages and the Relative Strength Index (RSI). For example, Moving Averages smooth out price fluctuations to reveal the underlying trend, which helps Pakistani traders decide when to enter or exit positions.
Effective use of forex trading graphs reduces guesswork and equips Pakistani traders to make more informed decisions based on real market behaviour.
Mastering these graphs involves understanding not just the lines or bars, but the story they tell about supply, demand, and trader psychology. A simple graph tracking the PKR/USD pair could highlight how political events like budget announcements or global oil price shifts affect currency movement.
By focusing on relevant chart types and indicators suited to your trading style, you can better navigate the forex market’s complexities. This guide will break down these components step by step, ensuring Pakistani traders gain practical skills to interpret graphs confidently and trade with clarity.
Forex trading graphs offer a visual representation of currency price movements over time, helping traders interpret the foreign exchange market's constant fluctuations. For Pakistani traders, understanding these graphs is essential since it allows them to spot trends, evaluate market behaviour, and plan their trades with more confidence. A clear grasp of forex graphs can prevent costly mistakes, especially in a market as volatile as forex.
Definition and purpose: A forex trading graph is simply a chart that shows how currency prices change over various timeframes. Whether it's seconds, minutes, hours, or days, these charts display price points to give traders a snapshot of market activity. The main purpose is to help traders visualise the price history and current state of a currency pair, which can guide their buying or selling decisions.
For example, if a PKR/USD graph shows a steady upward trend over the last week, a trader might decide it’s a good time to buy US dollars anticipating further gains. These graphs serve as crucial tools to reduce guesswork and add data-driven analysis to trading choices.
Role in currency market analysis: Forex graphs are central to technical analysis — looking at past price data to predict future movements. By studying patterns, traders identify support and resistance levels, entry and exit points, and gauge market sentiment. Without graphs, it’s nearly impossible to keep track of how different factors, like economic news or geopolitical events, reflect on currency prices.
For instance, during times of political uncertainty, the PKR rate may fluctuate sharply. Charts help traders pinpoint when these moves start and possibly when they might stabilise, offering a clearer sense of timing for trades.
Understanding market trends: Pakistani traders need to recognise long-term and short-term trends shown on forex graphs to make sound decisions. Currency markets don't move randomly; they often trend in patterns that traders can exploit. For example, a trader noticing a drifting downtrend in PKR against the US dollar might decide to delay purchasing foreign currency or hedge their investments accordingly.
Since Pakistan's economy frequently experiences shocks due to external debts, inflows of remittances, or political events, understanding these trends visually helps traders react quickly without relying on incomplete information.
Enhancing decision-making processes: Making trading decisions based on gut feeling alone is risky. Forex graphs provide objective data that lowers emotional impulses. When examining price charts, Pakistani traders can digest complex information — momentum, volatility, and trend strength — in an easier format.
For example, integrating graphs with indicators like moving averages can reveal whether a currency pair is set to reverse or continue its current direction. This approach saves time and sharpens strategy, especially when trading on platforms like MetaTrader or through Pakistani brokerage apps that offer real-time charting.
Properly reading forex graphs isn't just technical skill; it's practical knowledge that can save your capital and improve trading success rates. For Pakistani traders dealing with the volatile PKR exchange, these charts are indispensable tools in daily trading.
In short, mastering forex trading graphs equips you to make better-informed, timely trades reflecting the real market movements around you.
Different types of forex trading graphs help traders understand price movements in various ways. These charts offer insights into market behaviour and help spot trading opportunities. For Pakistani traders, knowing which graph to use can simplify analysis and improve decision-making.
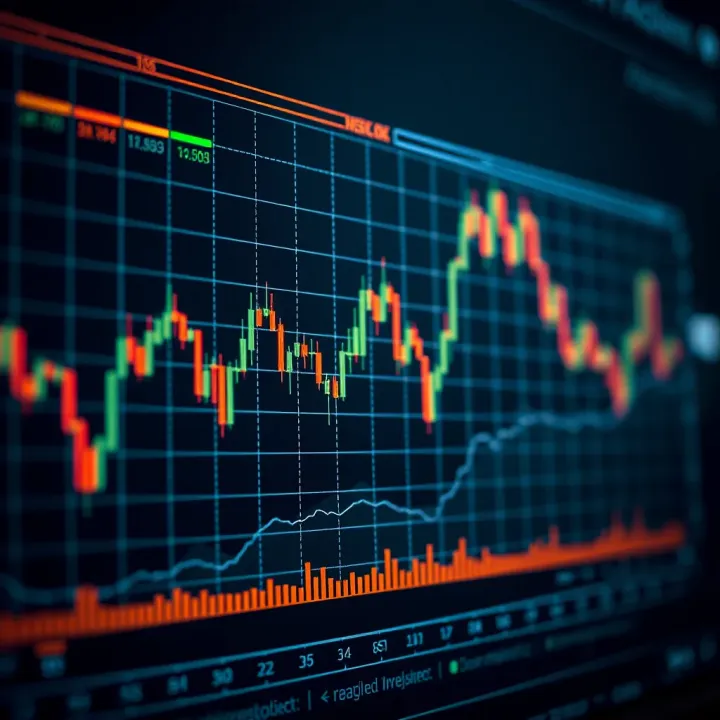
Line charts represent the closing prices of currency pairs over a period, connected by a simple line. This straightforward visualisation shows how prices move without clutter. For example, if the PKR/USD rate rises steadily over weeks, a line chart highlights that uptrend clearly.
Being simple, line charts suit beginners who want to grasp basic price trends without the noise of other data points. They help new traders follow markets easily before moving on to more complex charts.
Bar charts display four key data points for each time period: open, high, low, and close prices. Each bar shows the range (high to low) and the opening and closing values. This detail matters when analysing daily PKR fluctuations against other currencies during political or economic events.
Through bar charts, traders can interpret market volatility more precisely. Larger bars suggest greater price swings, which often occur around news releases affecting the rupee. Recognising such volatility guides traders on risk management and entry-exit points.
Candlestick charts have gained popularity in forex trading due to their rich visual information. Each candle shows the open, high, low, and close but in a colour-coded manner that helps quickly spot bullish (rising) or bearish (falling) sentiment.
Reading bullish and bearish signals becomes easier with these charts. For instance, a long green candle in PKR/JPY indicates strong buying, while a red candle shows selling pressure. This clarity helps traders react swiftly to market shifts.
Candlestick patterns also reveal market psychology through formations like "Doji," "Hammer," or "Engulfing". Spotting these helps traders anticipate reversals or continuations, weaving market sentiment into their analysis.
Understanding different forex graphs is not just technical exercise—it provides you key tools to read markets better and trade confidently amidst fluctuating currency exchanges.
Choosing between these graph types depends on your trading style. Beginners may start with line charts before exploring the detail in bar and candlestick charts. Each type complements various analysis strategies Pakistani traders use daily amid ongoing currency shifts and economic updates.
Key indicators are vital tools for traders who want to understand currency market behaviour more precisely. Pakistani traders, in particular, rely on these indicators to make informed decisions amid fluctuating PKR exchange rates and regional uncertainties. Indicators like moving averages, Relative Strength Index (RSI), and Bollinger Bands provide concrete insights about price trends, momentum, and volatility. These help avoid guesswork and reduce emotional trading.
Moving averages smooth out price data by creating a constantly updated average, helping traders spot the general direction of a market. The main types are the Simple Moving Average (SMA), which gives equal weight to all prices over a period, and the Exponential Moving Average (EMA), which assigns more importance to recent prices. For instance, Pakistani traders often use the 50-day SMA to see medium-term trends and the 20-day EMA for quicker market shifts.
Using moving averages to identify trends is practical because they reveal whether the market is bullish or bearish. When the price stays above a moving average, it suggests an uptrend; when below, a downtrend. Crossovers between short-term and long-term averages can signal entry or exit points. For example, if the 20-day EMA crosses above the 50-day SMA, it may indicate bullish momentum, a cue Pakistani traders watch closely before placing buy orders.
RSI measures market momentum by evaluating the speed and change of price movements. The index ranges from 0 to 100, showing whether a currency pair is gaining strength or losing it. Traders in Pakistan use RSI to gauge if momentum supports potential trend continuation or reversal, which aids in timing trades more effectively.
Overbought and oversold signals help prevent rash decisions based on temporary price spikes or dips. A reading above 70 suggests that the market might be overbought, meaning prices could correct downwards soon. Conversely, an RSI below 30 indicates oversold conditions, signalling possible price rebounds. When the PKR strengthens unusually against the USD and RSI hits over 70, traders might prepare for a pullback rather than continue buying blindly.
Bollinger Bands help understand market volatility by placing upper and lower bands around a moving average. These bands expand when markets become volatile and contract during calm periods. Pakistani traders monitor these shifts to adjust strategies according to market mood, whether stable or choppy.
Interpreting price breaks beyond Bollinger Bands can be a clue to potential trend shifts. A price moving outside the upper band could imply an overextension, hinting at a sell signal, while a break below the lower band might suggest a buying opportunity. For example, during a sudden geopolitical event impacting PKR, spikes beyond the bands warn traders to expect quick price corrections ahead.
Understanding and applying these key indicators improves Pakistani traders’ ability to read forex trading graphs effectively and act on reliable signals rather than hunches or rumours.
These tools, when combined thoughtfully, give a fuller picture of the forex market's behaviour, allowing better risk management and more confident trading decisions.
Understanding how to read and interpret forex trading graphs is key for any trader serious about succeeding in the currency markets. These graphs show critical information over time, allowing you to spot market direction, momentum, and possible reversal points. Without grasping graph reading skills, decisions tend to rely on guesswork rather than sound analysis.
Uptrends, downtrends, and sideways markets are the building blocks of forex graph reading. Uptrends happen when currency prices consistently make higher highs and higher lows, reflecting growing demand. For instance, if PKR against USD shows a steady rise over weeks, it suggests Pakistan’s rupee is strengthening. Downtrends are the opposite—prices making lower highs and lower lows, signaling weakening currency. Sideways or range-bound markets show little net change and indicate indecision or balance between buyers and sellers. Recognising these trends matters because you can align your trades with the market’s direction instead of trading against it, reducing unnecessary risks.
Common chart patterns like head and shoulders, double tops, and triangles help anticipate future price moves. For example, a head and shoulders pattern often signals a trend reversal, which means you might exit a long PKR/USD trade before losses build. Triangles suggest price consolidation before a breakout, useful if you plan your entry just as volatility picks up. While patterns don’t guarantee outcomes, they give clues that combined with other indicators improve your odds.
When analysing forex graphs, distinguishing short-term vs long-term analysis is vital. Short-term charts, such as 5-minute or hourly charts, capture quick price moves and benefit day traders or scalpers looking for rapid gains. Long-term charts, daily or weekly, reflect broader economic trends better suited for position traders. For instance, a trader focusing on Pakistan’s monetary policies affecting PKR might rely more on daily charts to see sustainable moves rather than minute-by-minute fluctuations.
Choosing appropriate timeframes depends on your trading style and goals. A swing trader might study multiple timeframes, starting with weekly charts to determine trend direction and then shifting to 4-hour charts for entry points. Using several timeframes together offers a clearer market picture rather than relying on one alone. It helps prevent poor timing and better aligns your trades with underlying momentum.
Many traders ignore volume data, but volume signals how strong a price move is. Low volume during a price rise might indicate weak buying interest, so the uptrend could fail. In Pakistan’s forex markets, certain currency pairs may have lower trading volumes during national holidays or uncertain political times, which impacts price reliability. Including volume in your analysis helps confirm moves or warn you against false signals.
Another pitfall is over-reliance on a single indicator like the RSI or moving averages. Indicators are tools, not crystal balls. For example, RSI might show oversold conditions but ignoring trend or volume could lead you to enter too early. Pakistani traders often get tempted to trust one metric because it appears easy, but combining multiple indicators offers more balanced judgement. Always cross-verify signals rather than acting on a single reading.
Mastering graph reading requires more than just knowing definitions; it involves practical application with awareness of common traps. For Pakistani traders, understanding local market context alongside technical signals can greatly improve trading decisions.
By developing skills to read trends, use timeframes wisely, and avoid frequent mistakes, you increase your chances of making profitable forex trades rather than falling prey to guesswork or hype.
Navigating the forex market requires more than just understanding graphs; Pakistani traders need practical tips that connect theory with the local trading environment. This section outlines crucial advice to help you make better decisions, manage risks, and adapt to Pakistan’s specific market conditions.
Platforms popular in Pakistan play a big role in how smoothly you can trade. Many traders here lean towards platforms like MetaTrader 4 and MetaTrader 5 because of their user-friendly interface and strong support for technical analysis. Local brokers also often provide access to these platforms along with customer service in Urdu or English, which is useful if you face issues. Ensuring your platform is licensed by Pakistan’s Securities and Exchange Commission (SECP) can protect you from scams.
Features to look for in charting tools include real-time price updates, various chart types (like candlestick and bar charts), and technical indicators such as moving averages or RSI. A good platform allows you to customise charts and set alerts for price movements, helping you react quickly to market changes. Since internet connections in many parts of Pakistan can be unstable, a platform that works well on slower networks or mobile apps is another plus.
Considering PKR exchange rate fluctuations is essential because the Rupee’s volatility directly affects forex trading decisions. For instance, political announcements or economic data releases can cause sudden PKR swings visible on your charts. By correlating these events with graph patterns, you can better time your trades. Keep an eye on WAPDA and SBP reports since energy shortages and monetary policy changes can impact investor confidence and the Rupee’s strength.
Impact of geopolitical events on forex graphs cannot be overstated in Pakistan’s context. Border tensions, international sanctions, or trade agreements quickly reflect in currency pairs involving PKR and major currencies like the US dollar. Such events cause sharp moves seen on trading graphs, so understanding the backdrop gives you an edge. For example, a diplomatic resolution might stabilise the rupee, which your charts will depict as a steady uptrend.
Using demo accounts available on most forex platforms lets you practise reading graphs and placing trades without risking real money. This hands-on approach helps you grasp how technical indicators behave under different market conditions, which builds confidence. Many Pakistani traders start on demo accounts before moving to live trading, avoiding early mistakes.
Following updates from SBP and FBR keeps you informed about regulatory changes and economic policies affecting forex markets. The State Bank of Pakistan’s monetary policies influence interest rates and currency valuation, while the Federal Board of Revenue’s tax notices might impact remittance flows or import-export dynamics. Including these updates in your analysis sharpens your ability to interpret forex graphs in light of real economic variables.
Practical tips tailored to Pakistan’s unique market improve your chances of success. By choosing the right platforms, factoring in local economic realities, and committing to ongoing learning, you can navigate forex trading graphs with confidence.
Learn effective forex trading strategies tailored for Pakistani traders 🇵🇰. Master market analysis, risk management, and practical tips to trade smartly.
📈 Explore effective forex trading techniques designed for Pakistani traders, covering practical tools, risk management, and strategies suited to local and global market trends.

Explore how forex trading demo accounts help Pakistani beginners learn risk-free trading 🤑. Get tips, key features & local insights for smarter trading strategies 📈.
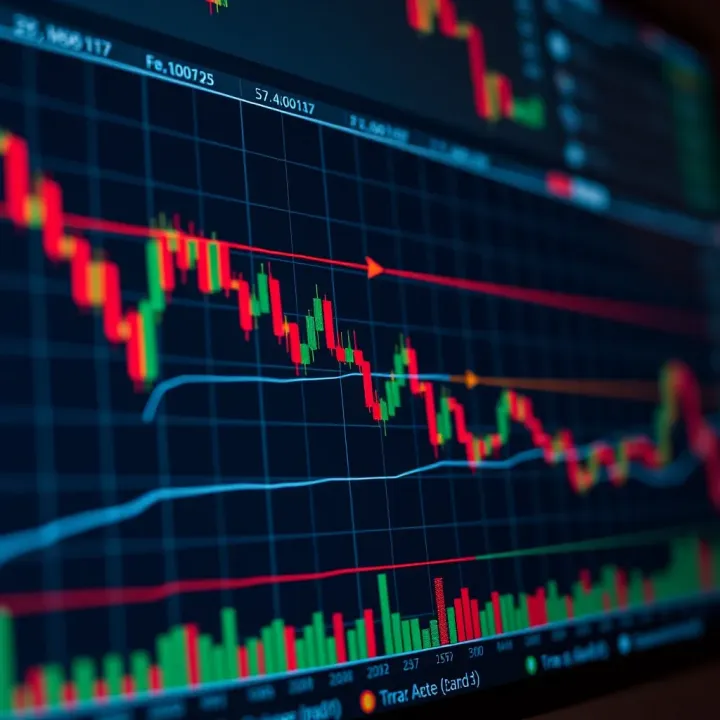
📊 Learn to spot forex trading patterns to make smarter market moves. Discover tips, tools, and mistakes to avoid for confident trading decisions in Pakistan’s forex scene.
Based on 7 reviews