

Forex Trading Guide for Pakistani Investors
🌍 Explore forex trading in Pakistan with clear tips on profit strategies, risks, regulations, and practical advice to trade foreign currencies confidently and safely.
Edited By
Emily Foster
Candlestick patterns provide valuable clues about price movements in forex trading. Originating from Japanese rice merchants centuries ago, these visual patterns are now a staple for traders worldwide, including those in Pakistan. They pack essential information about opening, closing, high, and low prices into simple bars, helping traders quickly gauge market sentiment.
Unlike other chart types, candlesticks give a clearer picture of market psychology. For example, a long green (bullish) candle suggests strong buying pressure, while a long red (bearish) candle shows selling dominance. Recognising these can help you decide whether to enter or exit a trade.
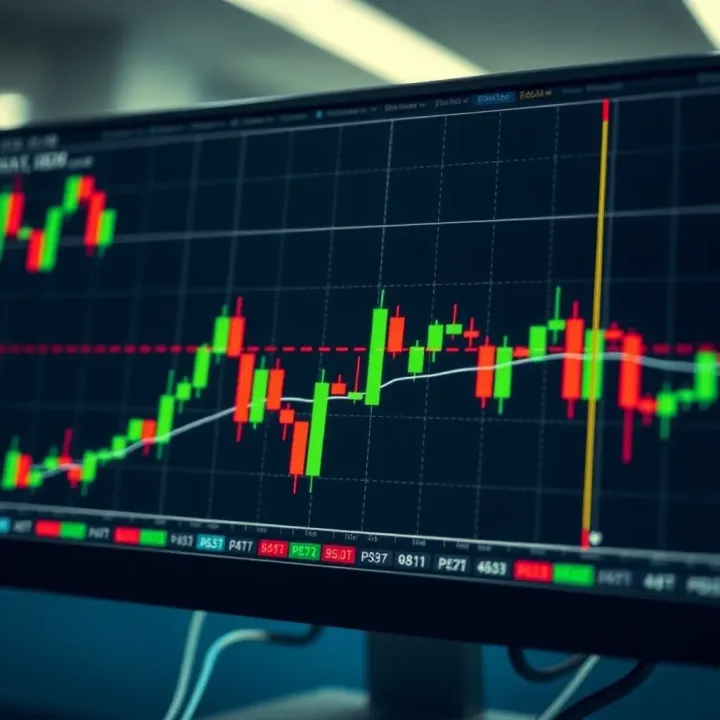
Understanding forex candlestick patterns involves identifying setups that suggest price continuation or reversal. Some common patterns include:
Doji: A sign of indecision where opening and closing prices are almost the same.
Hammer: A potential reversal signal with a small body and a long lower wick.
Engulfing Pattern: A strong reversal indicator where one candle fully covers the previous candle's body.
These patterns work best when combined with other technical tools and indicators like support and resistance levels or moving averages. For instance, spotting a hammer near a known support zone in the PKR/USD forex pair might signal a buy opportunity.
Many Pakistani traders overlook candlestick patterns, yet these visuals provide actionable insights that can greatly improve timing and risk management.
Using locally relevant PDF resources can deepen your understanding. Materials from Pakistani forex academies or brokers often include examples tailored to common currency pairs like USD/PKR or EUR/PKR. These guides usually break down pattern formation and illustrate practical scenarios.
To make the most of candlestick patterns:
Watch for patterns forming around key price levels.
Confirm with volume or other indicators.
Manage risk by placing stop-loss orders according to the candle’s size.
By mastering candlestick patterns, Pakistani traders can enhance their strategy and improve decision-making in volatile forex markets. This guide will equip you with detailed insights and useful PDFs to take your trading skills further.
Understanding the basics of forex candlestick charts is fundamental for any trader aiming to make informed decisions in the market. Candlestick charts provide a clear visual representation of price movements over specific time periods, allowing traders to gauge market sentiment quickly and act accordingly. This section breaks down the core concepts of candlestick charts, their structure, and why they are preferred over other chart types.
Candlestick charts consist of individual 'candlesticks' that represent the price activity in a given timeframe—be it one minute, one hour, or one day. Each candlestick shows four key prices: opening, closing, high, and low. The body of the candlestick reflects the range between the opening and closing prices, while the thin lines, called wicks or shadows, illustrate the highest and lowest prices reached during the timeframe. For instance, if the closing price is higher than the opening price, the candlestick is typically shown as hollow or in a lighter colour, signalling bullish movement.
This straightforward visual format helps traders spot price volatility and market momentum at a glance. For example, a long body indicates strong buying or selling pressure, while a short body suggests market indecision or consolidation.
When compared with other chart types like line charts or bar charts, candlesticks provide richer information. Line charts only display closing prices over time, giving a simplistic overview that may hide important details about intraday price action. Bar charts share similar data points as candlesticks but lack the intuitive visual cue of filled or hollow bodies, which many traders find easier to interpret quickly.
Candlestick patterns do more than just display price—they reveal underlying market psychology. Each formation embodies the tug of war between buyers and sellers, reflecting emotions such as fear, greed, hesitation, or confidence. Consider the Doji pattern, where opening and closing prices are nearly the same; it shows uncertainty in the market, often preceding a potential reversal. Recognising these psychological signals helps you anticipate market behaviour rather than just react to price movements.
These patterns play a key role in identifying trends and reversals, leading to better timing of entries and exits. For example, a bullish engulfing pattern might mark the end of a downtrend and the beginning of an upward rally. Traders often combine these patterns with volume data or other technical indicators to confirm signals. Knowing when a trend is likely to continue or reverse can save you from costly mistakes, especially in volatile currency pairs commonly traded in Pakistan, like USD/PKR or EUR/PKR.
Mastering candlestick basics not only sharpens your market analysis but also builds confidence to navigate forex trading with clearer insight.
Understanding common candlestick patterns helps traders spot market shifts early. These patterns often reveal whether buyers or sellers hold control, assisting decisions on entry or exit points. Many successful traders rely on these clues to time their trades better, especially in volatile markets like forex.
The Doji forms when a candlestick's open and close prices are almost equal, creating a very thin or nonexistent body. This pattern signals indecision in the market. For example, if a Doji appears after a strong uptrend, it can indicate buyers are losing their grip and a reversal might be near.
Traders spot Doji candles to prepare for potential trend changes, but relying on Doji alone is risky. Confirmation from the next candles or volume shifts strengthens its practical use for decision-making.
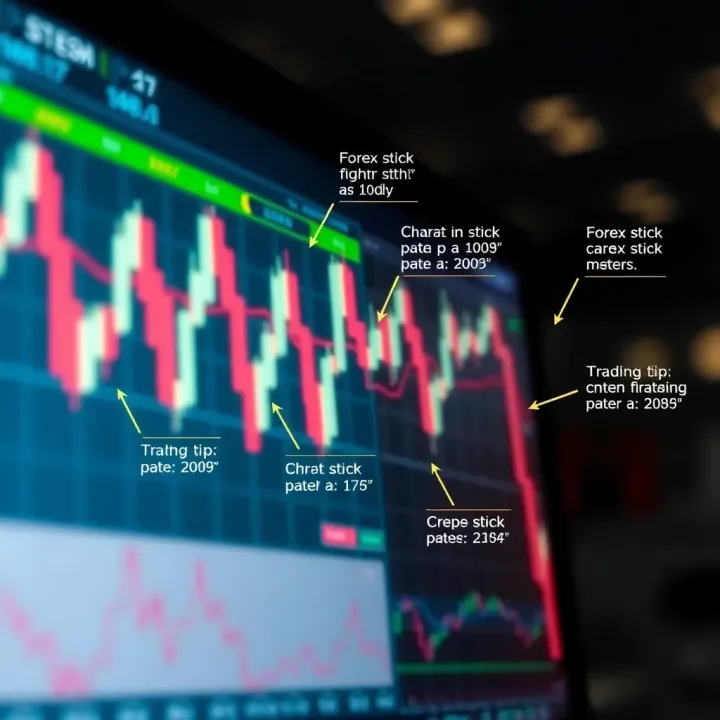
A Hammer has a small body near the top and a long lower wick, often signalling that selling pressure tried to push prices down but buyers pushed back. This pattern mainly appears after a downtrend and suggests a possible bullish reversal. For instance, in the PKR/USD pair, seeing a Hammer after a sell-off may hint that buyers are stepping in.
Using Hammer patterns helps traders spot potential bottoms in markets. Still, patience is key; waiting for the next candle to confirm the shift reduces false signals.
The Shooting Star is the opposite of a Hammer. It shows a small body near the lower end and a long upper wick, signalling that buyers pushed prices up but sellers took control by the session’s close. Usually found at the end of an uptrend, this pattern warns of a bearish reversal.
In pairs like PKR/EUR, seeing a Shooting Star after price gains may prompt traders to tighten stop-losses or consider short positions. Proper confirmation avoids acting on this pattern too early.
An Engulfing Pattern appears when a larger candle completely 'engulfs' the previous smaller candle’s body. A bullish engulfing happens at a downtrend's bottom, where a big green candle overtakes a prior smaller red candle, suggesting momentum shift towards buyers. The bearish engulfing shows the opposite at an uptrend’s top.
Such patterns carry stronger signals than single candles by reflecting significant shifts in market sentiment. Pakistani traders can watch for engulfing patterns on popular pairs like PKR/GBP for clearer trend reversal cues.
These are three-candle patterns marking trend reversals. The Morning Star starts with a long bearish candle, followed by a small-bodied candle signalling indecision, and ends with a bullish candle confirming the shift. The Evening Star reverses this sequence for bearish turns.
Applying these patterns helps traders catch early entry points after strong moves. For example, a Morning Star forming after a PKR/JPY drop could suggest a coming rally.
The Three White Soldiers pattern consists of three consecutive long bullish candles, signalling strong buying momentum. Conversely, Three Black Crows are three consecutive bearish candles, indicating heavy selling.
These patterns affirm ongoing trend strength rather than reversal. Traders tracking momentum in PKR/USD might use these to confirm holding positions or prepare for pullbacks.
Familiarising yourself with these patterns sharpens market reading skills, making your forex trading more responsive and confident.
By recognising these candlestick patterns and combining them with other tools, Pakistani traders can enhance their market timing and risk management effectively.
Candlestick patterns serve as valuable indicators for traders trying to make informed decisions in the fast-moving forex markets. Their role goes beyond mere visual appeal—each pattern reflects the battle between buyers and sellers, signalling potential turning points or continuations in price action. Understanding these clues can keep you one step ahead, helping you decide when to enter or exit trades with greater confidence.
Bullish candlestick patterns, such as the hammer or bullish engulfing, usually occur at the end of a downtrend and hint at a potential upward reversal. For example, if the PKR/USD pair shows a hammer pattern near a support level, it suggests buyers are regaining control, making it a point worth watching for a price rise. Conversely, bearish patterns like the shooting star or bearish engulfing often appear at the top of an uptrend, indicating sellers might take charge soon. Spotting these signs early can alert you to changing market sentiment and help avoid being caught on the wrong side of a trade.
While candlestick patterns provide clues, confirmation through volume and complementary indicators strengthens your market thesis. Increasing volume alongside a bullish reversal pattern, for instance, confirms genuine buying interest and lowers the risk of a false signal. Traders in Pakistan often combine candlestick readings with tools like the Relative Strength Index (RSI) or Moving Averages to validate trends. If the RSI shows oversold conditions as a bullish pattern develops, it adds weight to the possibility of a strong bounce, making your entry more reliable.
Not all candlestick patterns signal a reversal—some point to the market taking a breather. Patterns like dojis or spinning tops suggest indecision and a pause in momentum. For example, during consolidation of the EUR/PKR pair, these patterns show buyers and sellers are evenly matched, neither pushing prices decisively. Recognising these signals helps you avoid chasing breakouts prematurely and prepares you for the next move when it unfolds.
Trading during consolidation requires patience and a clear plan. You might wait for breakout confirmation above resistance or below support levels instead of trading within the congestion zone. Using candlestick patterns alongside volume spikes can indicate genuine breakouts. For instance, a bullish engulfing candle breaking out from a consolidation on the GBP/PKR chart with higher volume suggests a possible strong upward trend. Applying stop losses just outside the consolidation range also helps manage risks during these uncertain phases.
Candlestick patterns become truly effective when combined with volume and other technical tools; they give you a clearer picture of market moves, especially in volatile forex pairs common in the Pakistani trading scene.
Interpreting these patterns with care turns charts from mere price drawings into a powerful decision-making tool for forex traders.
Forex candlestick patterns offer Pakistani traders practical insight into market sentiment and price movements. When you adapt these patterns to the local trading environment, you gain a clearer edge in anticipating market behaviour on currency pairs that matter to Pakistani investors.
The PKR/USD pair remains the cornerstone for most forex activity in Pakistan. Its high liquidity and direct impact on import-export economics make understanding candlestick signals on this pair invaluable. Besides PKR/USD, pairs like PKR/EUR and PKR/GBP also attract attention, especially during global political developments or trade talks. Patterns signalling reversals or breakouts on these pairs often reflect real market reactions to economic policies, remittance flows, or geopolitical events affecting Pakistan.
Regional factors, such as tensions along the Afghan border, policy shifts in China due to CPEC projects, or changes in oil prices influenced by Middle East stability, can quickly shift market sentiment. These events lead to distinctive candlestick formations, often signalling sudden swings or prolonged consolidations. For example, an unexpected announcement from the State Bank of Pakistan (SBP) about currency intervention can trigger sharp bullish or bearish engulfing patterns, highlighting actionable moments for traders. Recognising these patterns in the context of Pakistan-specific news enhances decision-making accuracy.
Pakistani traders commonly use platforms like MetaTrader 4 (MT4), MetaTrader 5 (MT5), and TradingView for candlestick analysis. MT4 and MT5 offer robust charting features with extensive customisation suitable for PKR pairs, while TradingView provides a user-friendly interface with a strong social community. These platforms allow application of technical indicators alongside candlestick patterns, making them essential for comprehensive forex analysis tailored to the Pakistani market.
Reliable data is a must for accurate candlestick reading. Market participants in Pakistan often source forex rates and economic updates from the State Bank of Pakistan, commercial banks, and reputable international brokers providing Pakistan-specific spreads and real-time data. Using platforms with timely data feeds prevents lag when sensitive patterns form. Besides online sources, trading groups and analyst reports focusing on Pakistan’s economic conditions also help interpret candlestick signals more effectively.
Understanding forex candlestick patterns in the Pakistani context ties technical skills with real-world market dynamics. The combination makes trading strategies not only sharper but also more relevant to local economic shifts and currency pair behaviour.
PDF guides on forex candlestick patterns serve as useful tools for traders who want a structured approach to understanding market movements. These downloadable resources allow you to study patterns in detail, revisit important concepts at your own pace, and apply them to actual trading scenarios. Particularly for Pakistani traders dealing with volatile currency pairs like USD/PKR or EUR/PKR, having reliable PDFs helps in building confidence before risking capital.
PDF guides often organise information into clear sections, starting from basic candlestick anatomy to advanced pattern recognition techniques. This systematic layout saves time compared to scouring multiple websites or videos. For instance, a well-designed PDF might include charts showing common patterns, explanations of each pattern’s implication, and examples relevant to the Pakistani forex market. Such organised content ensures you don’t miss key details while making the learning process smoother.
Having the material saved offline means you can refer to it anytime, without internet dependence. It’s especially handy in areas with unstable connectivity or during loadshedding periods when online access is limited. You could practise identifying patterns on historical candlestick charts using your PDF notes side-by-side, even without real-time data. This flexibility supports consistent study habits and helps reinforce learning whenever it suits your schedule.
Look for guides published by recognised financial educators or brokers operating in Pakistan, such as IG Markets or local platforms offering educational material. The Securities and Exchange Commission of Pakistan (SECP) and the State Bank of Pakistan (SBP) occasionally provide market insight reports that include helpful charts, which may come in PDF form. Avoid random downloads from unknown sites to prevent misinformation or outdated content.
Focus on one pattern type at a time and cross-check examples from your trading platform, such as MetaTrader or TradingView, which are widely used in Pakistan. Make notes in your own words and highlight patterns that appear frequently with local currency pairs. Combine your reading with real trade reviews, noting how patterns played out. Using PDFs as a complement—not a sole resource—ensures that your understanding remains practical and grounded in current market behaviour.
Keeping a dedicated collection of reliable PDF guides can sharpen your forex trading skills by making complex candlestick analysis accessible and manageable. This, in turn, enhances your ability to make informed decisions in Pakistan’s ever-changing forex market.
🌍 Explore forex trading in Pakistan with clear tips on profit strategies, risks, regulations, and practical advice to trade foreign currencies confidently and safely.
📈 Explore forex trading in Pakistan with insights on regulations, trusted platforms, risks, and local challenges. Stay informed to make smarter trading decisions.
🔍 Explore key candlestick patterns to master price moves. Learn single & multiple formations, tips to read signals, and smart combo with indicators!
📈 Master advanced candlestick patterns with clear tips and accurate analysis to boost your trading decisions in Pakistan's markets. Sharpen your skills today!
Based on 13 reviews