

Understanding Chart Patterns for Traders in Pakistan
📊 Learn key chart patterns in technical analysis to improve your trading skills. Explore major types and access reliable Pakistani resources like books and PDFs.
Edited By
James Thornton
Candlestick charts are a key tool for traders and investors to read market action quickly. They show price movement over a set period, using a body and wicks that illustrate the opening, closing, high, and low prices. By spotting certain candlestick patterns, you can identify potential market reversals or continuations without relying solely on indicators.
Some basic yet powerful patterns to recognize include:
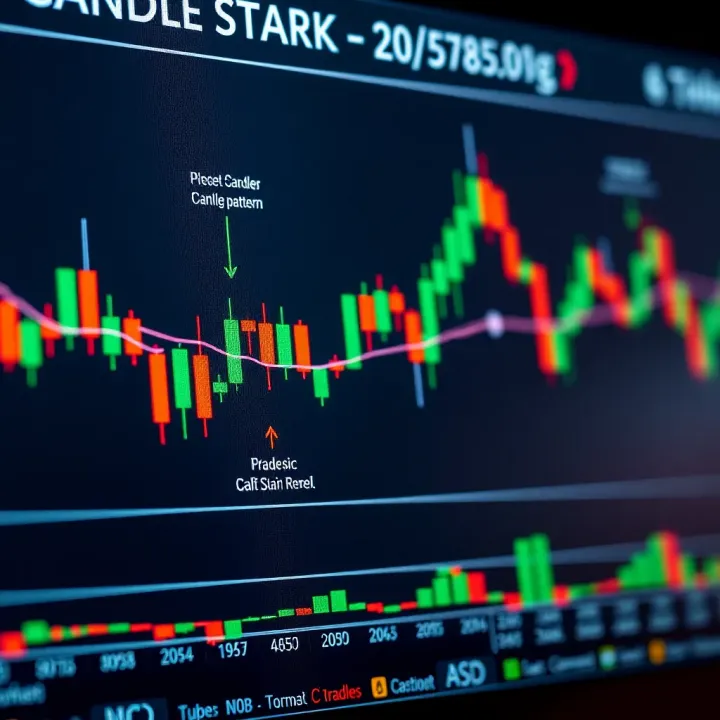
Doji: Indicates indecision when the open and close prices are nearly the same. It often signals a possible trend change.
Hammer: A candle with a small body and a long lower wick, suggesting buyers pushed prices back up after a sell-off.
Engulfing: When one candle fully covers the previous one’s body—bullish engulfing implies upward momentum; bearish suggests declines.
Understanding these helps you anticipate shifts before the broader market reacts.
Savvy traders use candlesticks as a visual shorthand to gauge market sentiment at a glance, making split-second decisions easier.
Advanced patterns like the Evening Star and Morning Star incorporate multiple candles to predict reversals more reliably. They’re a bit trickier but can be extremely useful when used with solid risk management.
Using downloadable PDF guides can make mastering these patterns easier. Having a quick-reference chart handy while trading or studying allows you to reinforce recognition skills faster. Plus, you can compare live charts to the examples, seeing how subtle differences affect the pattern’s reliability.
Here’s how to make the most of candle pattern learning:
Start with basic patterns and commit to identifying them in real charts.
Gradually add advanced patterns and note their occurrence in various market conditions.
Use PDFs as visual aids and for practice quizzes—this kind of active learning beats passive reading.
With consistent effort, recognizing these patterns becomes second nature, enhancing your trading accuracy and confidence.
The bottom line: candlestick patterns give you a straightforward, effective way to decode price action. Building this skill with practical resources like PDF guides puts you at an advantage in the fast-moving trading world.
Candlestick charts are a cornerstone tool for traders and investors aiming to understand market movements quickly. They offer a visual snapshot of price activity within a specific timeframe, making complex data easier to digest at a glance. Learning how to read these charts unlocks insights into market sentiment and potential price directions, which is essential whether you're trading stocks, cryptocurrencies, or commodities.
Structure of a candlestick: body, wick, and shadow
Each candlestick consists of three parts: the body, the wick (or shadow), and the tail (also sometimes called the shadow). The body reflects the opening and closing prices during the selected timeframe. When the closing price is higher than the opening, the body is usually hollow or green, indicating upward movement. Conversely, a filled or red body shows the price closed lower. The wick extends above and below the body to mark the highest and lowest prices reached. This structure helps traders quickly see both the range and direction of price action.
How candlesticks represent price action
Candlesticks are like visual stories of what happened during a trading period. For example, a long upper wick suggests buyers pushed prices up but sellers regained control near the close, hinting at resistance levels. Meanwhile, a long lower wick indicates sellers drove prices down but buyers stepped in before the close. Such patterns provide clues about buying and selling pressure, helping you anticipate short-term shifts.
Difference between candlestick and bar charts
Candlestick charts and bar charts both show price ranges, but candlesticks include a filled body that gives a clearer signal about price direction during that period. Bar charts use lines to represent open, high, low, and close, which can be harder to interpret quickly. Traders tend to prefer candlesticks because they combine price range with directional cues in an intuitive format, speeding up decision-making under fast market conditions.
Visualizing market sentiment
Candlestick patterns visually capture how investors feel—whether they're confident buyers or cautious sellers. For example, a hammer candlestick with a small body and long lower wick often reflects hesitation from sellers and potential buying strength. This makes it easier to spot shifts in sentiment than just looking at price numbers.
Predicting short-term price movements
Many traders use candlestick formations as early warning signs of possible reversals or continuations. For instance, a doji pattern where open and close prices are nearly the same suggests indecision that could lead to a trend change. Recognizing these patterns helps traders time their entries and exits rather than guessing blindly.
Combining patterns with other indicators
Candlestick patterns work best alongside other tools like moving averages or volume analysis. For example, spotting a bullish engulfing pattern near a moving average support level, confirmed by rising volume, lends extra confidence in taking a long position. This integration reduces false signals and improves trading accuracy.
Understanding candlestick charts isn't just about memorizing shapes—it's about reading the market's pulse in real time and making informed trading moves based on clear visual evidence.
By mastering the basics and learning why traders rely on these patterns, you set a solid foundation for applying candlestick analysis effectively in your trading strategies.
Understanding common candlestick patterns is a core part of reading market sentiment at a glance. These patterns offer traders quick insights on potential price moves without needing complicated calculations. By recognizing these visual clues, you can anticipate changes in momentum, identify entry or exit points, and refine your risk management.
A Doji candlestick forms when the opening and closing prices are nearly the same. It looks like a cross or plus sign, signaling market indecision. Neither buyers nor sellers have control, and the tug of war results in a stalemate. For example, if a Doji appears after a strong upward run in a stock like Apple (AAPL), it hints that bulls may be tiring. Traders then watch closely for confirmation, because the Doji itself is just a warning that the current trend might pause or reverse.
Both the Hammer and Hanging Man have small bodies with long lower shadows. Their meaning depends on the preceding price action. A Hammer appearing after a downtrend suggests sellers pushed prices lower but buyers regained control by the close — it often means a potential bullish reversal. On the other hand, a Hanging Man after an uptrend warns of a possible bearish reversal, signaling sellers starting to challenge the buying pressure. For instance, if Bitcoin charts show a Hammer following a dip, it's a hint buyers might be stepping back in.
A Spinning Top candlestick has a small real body with long upper and lower shadows, reflecting balance between buyers and sellers. This pattern signals uncertainty and often appears during consolidations or just before a trend change. For example, if Tesla (TSLA) stock has a series of Spinning Tops after a rally, it suggests buyers and sellers are evenly matched, and momentum could slow down or reverse.
Engulfing patterns involve two candles where the second completely "engulfs" the first's real body. A Bullish Engulfing occurs after a downtrend when a large green candle overtakes a smaller red one, signaling shift toward buying pressure. Conversely, a Bearish Engulfing after an uptrend shows sellers taking control. Suppose Amazon (AMZN) shows a Bullish Engulfing pattern near key support — that's a strong signal many traders watch to jump back in.
These three-candle patterns represent strong reversal signs. A Morning Star appears after a downtrend, starting with a long red candle, followed by a small-bodied candle (star), and then a big green candle that closes above the midpoint of the first. It’s like the market catching its breath before moving up. The Evening Star flips this sequence, signaling a bear reversal after an uptrend. For example, an Evening Star on NVIDIA (NVDA) charts could warn of cooling momentum.
A Harami consists of a large candle followed by a smaller candle entirely within the first’s body, like a baby inside a mother’s embrace (Harami means "pregnant" in Japanese). It suggests momentum is slowing and the current trend may be losing steam. In crude oil futures, spotting a bearish Harami can prompt a closer look for price weakness.
Identifying these patterns doesn't guarantee trades, but they help decode market psychology and improve timing when combined with other tools like volume and trend analysis.
The bottom line is mastering these candlestick patterns adds a powerful visual edge. Keep practicing with real charts to sharpen pattern recognition and gain confidence for live trading decisions.
Reading candlestick patterns is only half the battle; understanding how to fit them into your trading strategy is what really makes a difference. These patterns offer clues about potential market moves, but without context, they can mislead you. The key lies in analyzing candle formations alongside volume trends, broader market direction, and knowing how to set smart entry and exit points. This practical approach helps you make decisions grounded in reality, not just guesses.
Volume acts as a reality check for candlestick signals. For example, a bullish engulfing candle can look promising, but if it appears on low volume, the move might lack conviction. On the flip side, strong volume during a pattern often means real buying or selling pressure. Think of volume like the audience’s applause—louder cheers confirm the star performance.
Looking at the bigger trend is equally important before acting on a pattern. Catching a hammer candle at the bottom of a downtrend is more meaningful than the same candle appearing mid-trend. If you spot a reversal pattern but the overall market is firmly bearish, it’s wise to wait for additional confirmation rather than jump in. This helps avoid the costly trap of acting on false hope.
Avoiding false signals boils down to patience and cross-checking. Candlestick patterns sometimes pop up just because the market is jittery, not because a genuine shift is underway. Combining your pattern analysis with moving averages or RSI can filter out many dud signals. Remember, no pattern guarantees success, but layering your analysis reduces risks significantly.
Candlestick patterns often tell you when to get in or get out, but the timing must sync with your strategy. For instance, entering a trade right after a morning star pattern completes gives you a better shot at catching the upswing early. However, rushing in too soon—like acting after just one small bullish candle—can backfire. Waiting for the full pattern formation keeps your timing sharp and deliberate.
Stop-loss orders are your safety net, and candle structures can guide where to place them. If a hammer signals a potential bottom, setting a stop-loss a few cents below its wick gives you room for natural market wiggles without risking too much. This technique helps protect your capital while allowing the trade enough breathing space.
On the profit side, patterns hint at realistic targets. For example, after spotting a double top reversal, aiming for a price drop equal to the height between the tops and the trough is a common tactic. Setting profit goals linked to pattern outcomes keeps emotions in check and helps you stick to a disciplined exit plan.
Bottom line: Candlestick patterns are far more useful when combined with volume, trend context, and clear entry-exit rules. They’re tools to make decisions smarter, not guesses luckier.
By interpreting candle patterns with these practical strategies, you’ll bring your trading closer to a calculated art rather than a roll of the dice.
PDF guides offer traders a highly practical way to deepen their understanding of candlestick patterns. Unlike scrolling through websites or videos, PDFs provide a static, organized format that you can keep handy for quick reference. They allow traders to study complex patterns systematically, without distractions, making them a valuable companion in mastering these essential chart tools.
One major advantage of PDF guides is their offline accessibility. Whether you're on a trading floor with spotty Wi-Fi, commuting, or simply prefer studying away from screens, PDFs let you review patterns anytime. Traders often use tablets or smartphones to keep these resources in their trading kit, ensuring they can refresh their knowledge right before market hours, even without internet.
In the heat of trading, you don't have time to sift through bulky textbooks or webpages. PDFs with clear sections and well-labeled pages serve as quick lookups for confirming patterns on the fly. For example, spotting a potential “morning star” pattern? You can instantly pull up the PDF, check the exact setup criteria, and make informed decisions fast, avoiding hesitation or guesswork.
Good PDF guides often follow a logical flow, starting with basics and moving toward advanced patterns. This structure helps both newcomers and experienced traders revisit topics systematically. You can mark up pages, add notes in margins, and track your progress—practical features that boost long-term retention and understanding.
A PDF guide should include crisp, readable charts and diagrams highlighting key candlestick patterns. Visual clarity matters because these patterns are all about shapes and relationships between open, close, high, and low prices. Besides pictures, well-written explanations must avoid jargon, using straightforward language that traders can grasp quickly, similar to how Investopedia explains patterns.
Theoretical knowledge alone won’t cut it. Look for PDFs that showcase actual market examples, like screenshots from Apple or Tesla stock charts illustrating patterns during different market conditions. Real-world cases help traders understand how patterns play out in practice and avoid mistaking random movements for genuine signals.
A solid guide covers a wide range of patterns: from simple single-candle signals like the doji or hammer to complex multi-candle patterns such as the morning star or harami. This range lets traders build a versatile toolkit for various market situations, ensuring they’re prepared whether trading stocks, forex, or cryptocurrencies.
Bottom line: A well-designed PDF guide is an irreplaceable tool for anyone serious about applying candle chart patterns effectively. It combines accessibility, clarity, and practical examples to support quicker, more confident trading decisions.
Mastering candlestick patterns takes more than just memorizing shapes. You need to develop solid skills and blend those patterns with other tools for reliable decision-making.
Regular practice with charts is the backbone of getting good at reading candlestick patterns. Spending time daily reviewing real market charts trains your brain to quickly spot key formations like hammers or engulfing patterns. For example, watching how a bullish engulfing candle appears after a downtrend can help you anticipate a reversal in similar future scenarios.
Using simulation tools and backtesting allows you to test your pattern recognition without risking actual money. Platforms like TradingView or ThinkOrSwim offer paper trading features where you can apply patterns in simulated environments. Backtesting past data, say checking how often a morning star pattern led to a price rise on a specific stock, builds confidence and refines your approach.
Recording and analyzing trades is crucial for continuous improvement. Keep a trading journal logging the candlestick patterns you acted on, the outcome, and your thought process. This habit reveals which patterns work best for you and highlights mistakes, such as chasing weak signals or ignoring larger trends.
Integrating moving averages and oscillators strengthens your trading signals. For example, seeing a bullish hammer form near the 50-day moving average while the RSI indicates oversold conditions adds weight to a potential bounce. These extra layers reduce the chance of false signals.
Risk management strategies must accompany pattern-based trades to protect capital. Setting stop losses just below the pattern’s low or previous support level helps limit losses if the trade fails. Also, sizing your positions wisely ensures no single trade can blow up your account.
Avoiding over-reliance on single patterns is essential. No candle pattern guarantees success 100% of the time. Use them alongside volume analysis, trend context, and other indicators to confirm signals. For instance, a doji candle in isolation shows indecision, but combined with decreasing volume might reinforce a pause rather than a reversal.
The bottom line is that candlestick patterns work best when combined with consistent practice and other technical tools. This approach helps traders make smarter, more confident moves in fast-moving markets.
📊 Learn key chart patterns in technical analysis to improve your trading skills. Explore major types and access reliable Pakistani resources like books and PDFs.

📊 Learn key chart patterns to predict market trends and improve trading in Pakistan. Find detailed explanations and PDF resources for practical use and strategy.
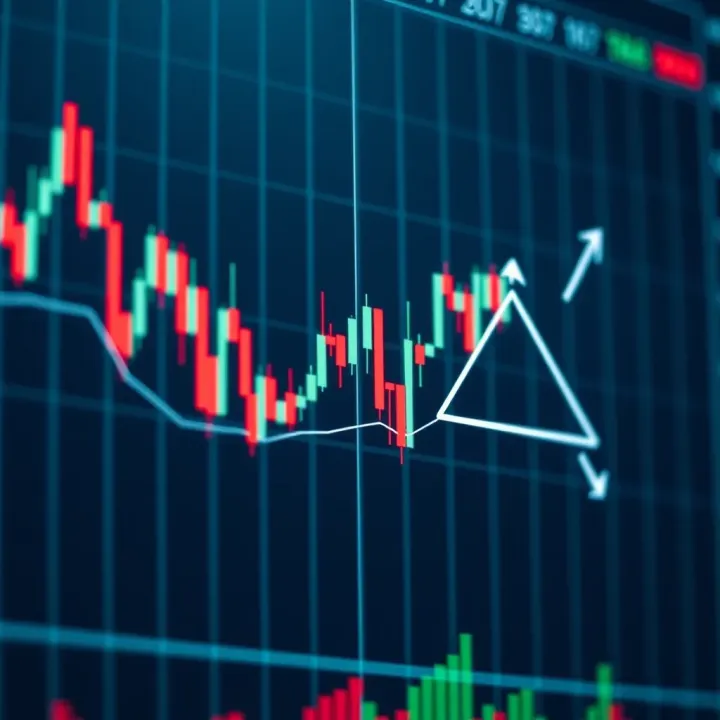
📈 Understand key trade chart patterns to spot trends and predict price moves. Use PDF guides for quick reference and sharpen your trading skills effectively in Pakistan.
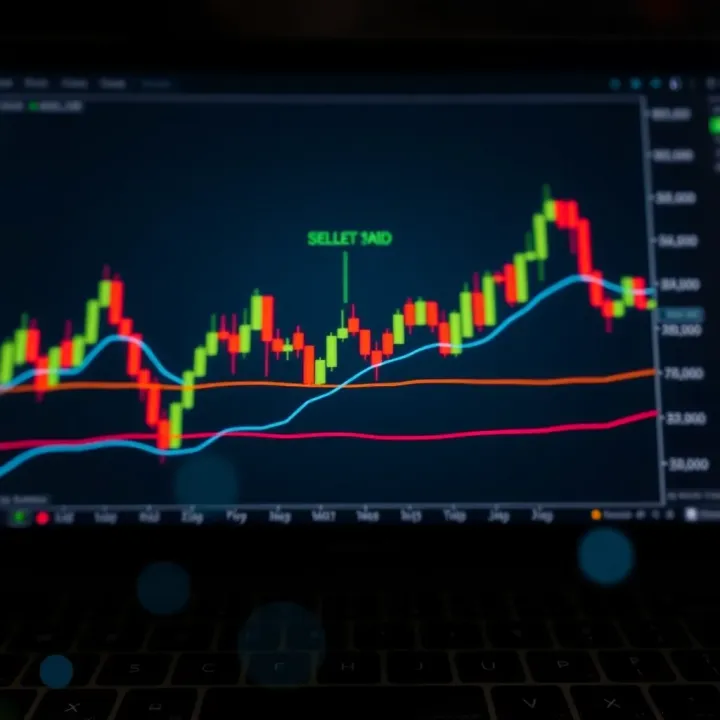
📊 Learn how Japanese candlestick patterns help decode market trends with clear examples and practical tips for Pakistani traders. Access useful PDF guides too! 📈
Based on 5 reviews